

1. Overall Trend Structure
XRP’s price action typically exhibits:
🔹 A multi-year ascending trend with periodic corrections
🔹 Rotation between accumulation zones and breakout phases
🔹 Sensitivity to broader crypto risk sentiment
Right now, XRP is trading within a range defined by long-term support and resistance levels. The long-term trend remains structurally bullish, but with intermediate consolidation and short-term volatility.
📉 2. Key Support & Resistance Levels
Identifying precise levels helps frame bias and potential pivot zones:
📌 Major Support Zones
- $0.85–$0.95 — Historically strong demand zone; multiple rejections
- $0.70–$0.75 — Secondary support from recent swing lows
- $0.60 — Psychological round number support
These levels act as areas where buyers have historically stepped in.
📌 Critical Resistance Levels
- $1.15–$1.25 — First line of overhead resistance
- $1.40–$1.50 — Broader medium-term supply zone
- $1.70+ — Next major resistance beyond recent highs
Breaking above these zones with sustained volume signals shifting bias.
📊 3. Chart Patterns & Structure
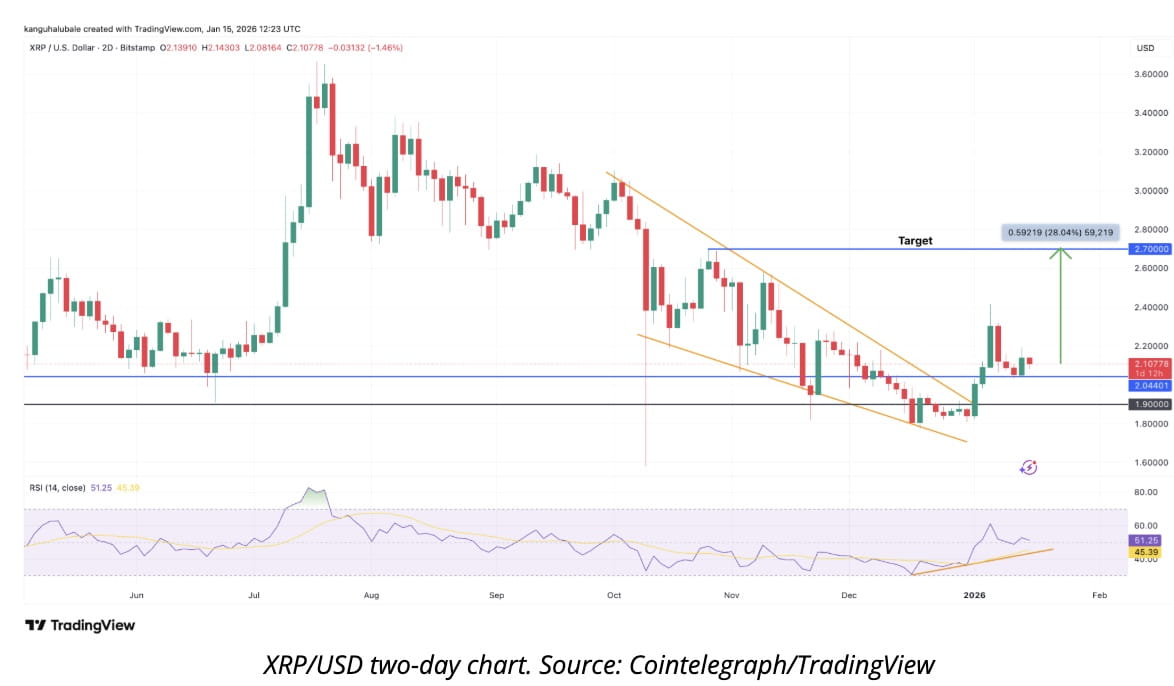
🟦 Range Bound
XRP has been trading sideways within a horizontal range — defined by near-term support and resistance.
This often indicates:
- Consolidation after a prior swing
- Indecision between buyers and sellers
- A buildup of liquidity for a directional move
A breakout above resistance suggests trend continuation. A breakdown below support suggests deeper correction.
🟨 Higher-Timeframe Trend
On the weekly chart, the higher timeframe trend remains neutral to mildly bullish so long as long-term support holds.
However, the failure to reclaim higher highs indicates loss of short-term momentum.
⏱️ 4. Moving Averages (MA)
Moving averages help gauge dynamic trend bias.
- 50-period MA (short-term) — Currently near the middle of the range; price fluctuates around it
- 100-period MA (medium-term) — Neckline level; acts as equilibrium point
- 200-period MA (long-term) — Still below current price, indicating structural support
If price stays above the 200 MA, trend bias remains intact. Sustained drops below 100 and 50 MA amplify bearish pressure.
📈 5. Momentum Indicators
📌 RSI (Relative Strength Index)
- RSI near neutral (40–60) signals range behavior without major trend conviction
- Escapes above 60 confirm bullish momentum
- Dives below 40 suggest bearish tilt
Look for RSI divergences (price higher highs vs RSI lower highs) as early reversal signs.
📌 MACD (Moving Average Convergence Divergence)
MACD currently near signal line cross — a classic momentum inflection:
- Bullish crossover = potential trend revival
- Bearish cross underneath zero = increased downside risk
Watching MACD histogram cycles helps time entries/exits.
🔄 6. Volume Behavior
Volume is the fuel behind moves:
- High volume on upside moves strengthens breakout validity
- Low volume breakouts often fail and revert back
- High volume on support tests indicates absorption by buyers
Currently, volume contracting during consolidation suggests indecision — traders are waiting for a catalyst.
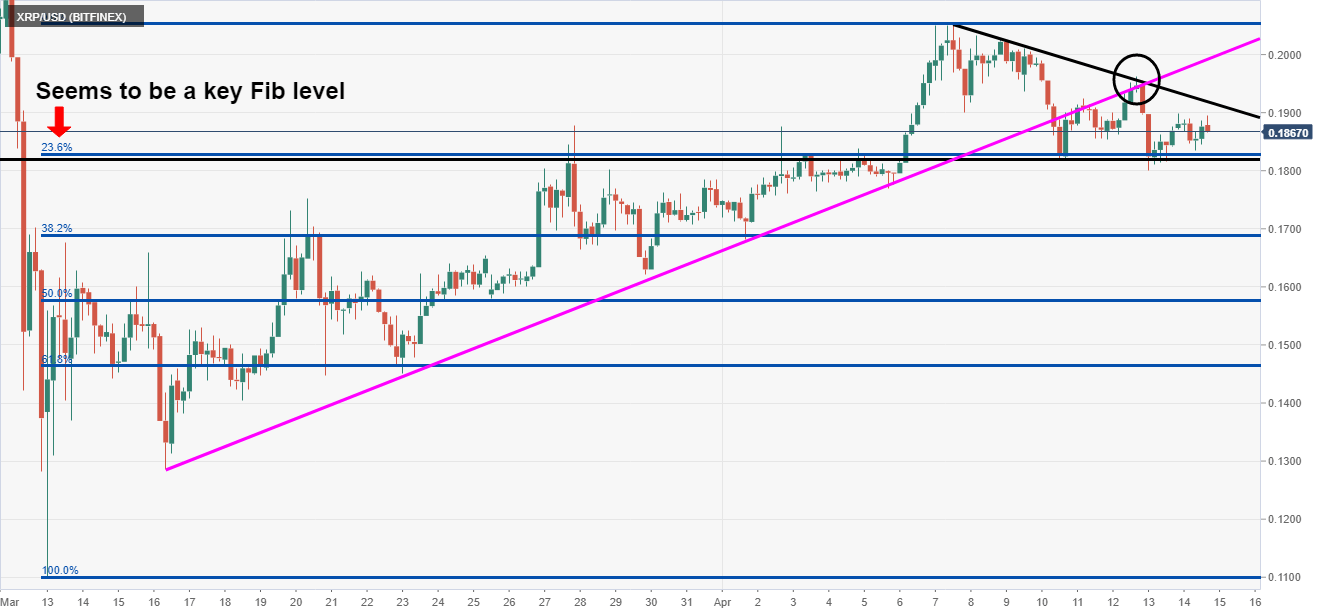
📊 7. Fibonacci Retracement Levels
Fibonacci levels from recent swing low to swing high can highlight retracement targets:
- 23.6% retrace = shallow pullback zone
- 38.2% retrace = moderate support zone
- 50% retrace = key psychological level
- 61.8% retrace = deep correction area
Price respecting these levels often signals trend discipline.
🧠 8. Potential Scenarios
🟢 Bullish Scenario
- Price breaks above $1.25 on strong volume
- RSI pushes beyond 60
- MACD crosses bullish
- Confirm breakout with retest-and-hold
Targets:
$1.40 → $1.50 → $1.70+
🔴 Bearish Scenario
- Price fails at resistance and breaks below $0.95 support
- RSI drops below 40
- MACD turns negative
- Increased selling volume
Targets:
$0.85 → $0.75 → $0.60
📌 9. Risk Management Levels
High-probability strategies involve layering risk:
- Stops below key support (e.g., 5–8% below entry based on volatility)
- Scaled entries on retests
- Profit tiers aligned with resistance levels
Risk management prevents one bad trade from dominating a portfolio.
🧾 10. Summary Bias
| Category | Current Bias |
|---|---|
| Short-Term | Neutral / Range |
| Medium-Term | Cautious Bullish |
| Long-Term | Bullish if support holds |
| Momentum | Flat / indecisive |
| Volume | Low; awaiting catalyst |
XRP is currently in a decision zone. Breakouts above resistance amplify bullish bias. Breakdowns below support shift bias toward correction.