

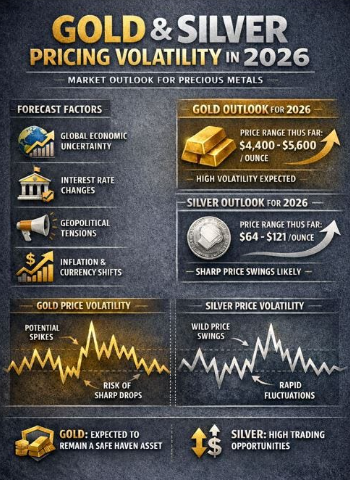
Precious metals are trading like markets that have re-rated to a higher-volatility regime: strong directional impulses, sharp pullbacks, and frequent “level-to-level” moves driven by positioning, yields, and risk sentiment. As of late February 2026, gold is back above the psychologically important $5,100 area, while silver is printing large daily ranges above $80—a reminder that when silver trends, it tends to trend violently.
This post breaks down the technical structure, market positioning signals (as inferred from price behavior), key support/resistance levels, and base/bull/bear targets for both metals across multiple time horizons.
1) Market Snapshot: Where We Are Now
Gold (XAU/USD)
Spot gold is trading around $5,104/oz with an intraday range roughly $4,981–$5,105 recently observed.
That positioning matters: if gold can consistently hold above $5,100, it converts a psychological ceiling into a potential demand shelf—often a prerequisite for trend continuation.
Silver (XAG/USD)
Spot silver is trading around $84.65/oz, having recently printed a wide range roughly $77.46–$84.71.
Silver’s volatility is a feature, not a bug. Treat it like a high-beta expression of the precious-metals complex—especially in momentum phases.

2) Macro Backdrop (Why Technicals Matter More Than Narratives Right Now)
Even if you’re a technical trader, it helps to know what keeps the trend alive:
- Geopolitical risk tends to reinforce safe-haven demand, but markets can “price it in” quickly, then consolidate.
- Rates and the USD still matter: dips often coincide with stronger dollar / higher real-yield impulses, while rallies thrive when financial conditions loosen.
- Central bank demand and “debasement” narratives can extend gold cycles, though different banks disagree on how durable the impulse is.
The practical takeaway: technical levels are being respected because flows are large and systematic. When trend followers and options hedging dominate, price often moves “magnet-to-magnet.”
3) Gold Technical Analysis (XAU/USD)
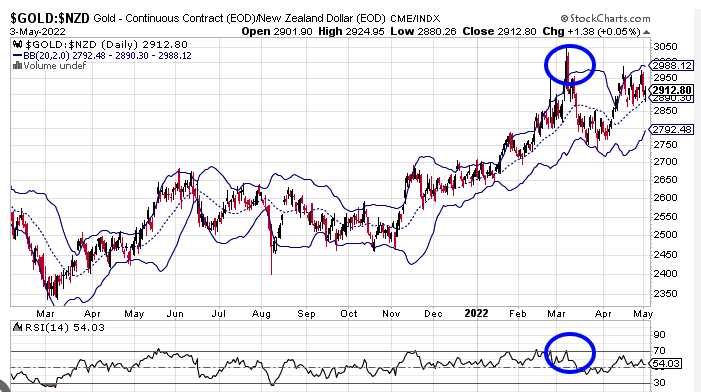
A) Primary Trend and Structure
Gold’s broader trend remains up, with recent price action characterized by:
- A strong run-up,
- a pullback/consolidation,
- and then renewed attempts to reclaim and hold the $5,000 zone.
From a market-structure perspective, $5,000 is not just “round-number psychology.” It’s also where many traders anchor:
- prior breakout/failed breakout levels,
- options strikes,
- and “regain/lose” rules used in systematic strategies.
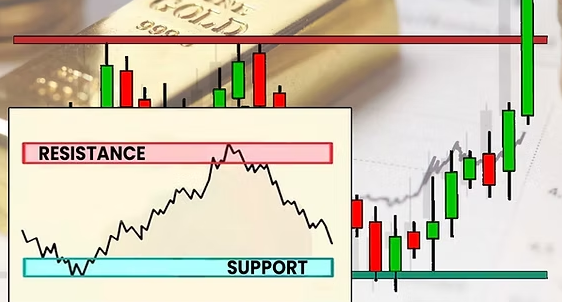
B) Key Levels: Support and Resistance Map
Think in zones, not single ticks:
Resistance (overhead supply)
- $5,100–$5,150: current “near-term acceptance” area (price is testing/near it).
- $5,345: a commonly referenced upside objective in recent analyst technical commentary (acts as a logical measured-move area).
Support (areas where bids should show up)
- $5,000: primary psychological + technical pivot.
- ~$4,842: cited as a meaningful support area in recent gold technical outlooks.
- $4,980 area: recent observed daily-range low region (near-term “line in the sand”).
C) Indicator Read (How I’d Frame It Without Overfitting)
Without pretending we have your exact chart settings, the simplest high-signal approach is:
- Moving averages (trend filter): If gold is holding above its intermediate trend measures (like a 50-day), pullbacks tend to be buy-the-dip until proven otherwise.
- Momentum (RSI/MACD conceptually): After strong runs, gold often needs a digestion phase; failure to accelerate on scary headlines can be a hint that the market is consolidating rather than sprinting.
In other words: the trend is up, but the market may be in a “rebuild energy” phase rather than a straight-line continuation.
D) Gold Price Targets (Scenario-Based “Prediction”)
These targets assume spot pricing and are best treated as conditional.
1–4 week horizon
- Base case (most likely): Chop/hold above $5,000 with attempts toward $5,100–$5,150; a sustained close above may open a move into the mid-$5,000s.
- Bull case: Daily closes hold above $5,000 and momentum expands → test $5,345.
- Bear case: Lose $5,000 and fail to reclaim quickly → drift toward $4,842–$4,900 support region.
3–6 month horizon
- Base case: Higher-high/higher-low structure continues, but with deep pullbacks; gold oscillates between $4,850–$5,350 with a bias upward if $5,000 remains a “buyable dip.”
- Bull case: Trend extension toward new highs above the prior peak zone (you’d use measured moves + weekly closes above resistance to validate).
- Bear case: Sustained break under ~$4,842 implies a more meaningful regime change (trend damage), increasing odds of a multi-month corrective phase.
12 month horizon (high uncertainty)
A prominent bank forecast cited recently points to around $5,400 by end of 2026 (forecast, not guarantee).
Technically, that aligns with the idea that a confirmed hold above $5,000 can act as a launchpad to the next “round-number magnet” area in the mid-$5,000s.
4) Silver Technical Analysis (XAG/USD)
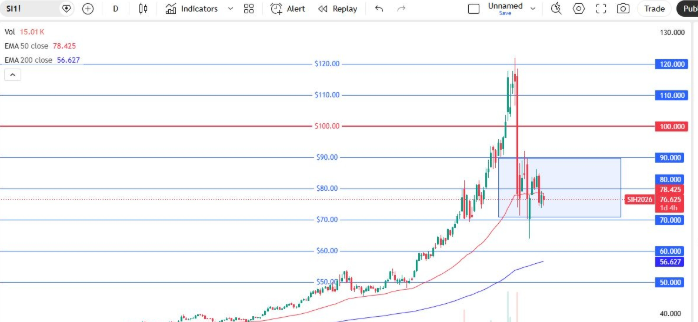
Silver is where technical analysis becomes less about perfection and more about risk geometry: define the level, size the position, respect the stop, because the swings can be enormous.
A) Primary Trend and Structure
Recent commentary across technical outlets highlights silver’s move back above $80, with attention on whether it can clear/hold around key moving averages and prior resistance zones.
At the same time, other analyses warn of negative signals (e.g., momentum divergence/overbought conditions), which is typical after explosive legs.
Net: uptrend behavior, but short-term mean-reversion risk is elevated.
B) Key Levels: Support and Resistance Map
Resistance (overhead supply)
- $82–$84: cited as a major resistance zone / record-area resistance in some recent technical commentary.
- ~$87.5–$95: repeatedly referenced as a higher-timeframe resistance/target zone.
- $92: a commonly referenced resistance area in short-term outlooks.
- $100–$104: big psychological zone (if silver enters a momentum squeeze, these magnets can matter).
Support (where pullbacks can stabilize)
- $76–$77.5: highlighted as a key pivot support area in recent technical notes.
- $70–$72: described as a major range support zone.
- ~$64: referenced as a February swing-low region in some short-term outlooks.
C) Indicator Read: What Matters Most for Silver
Silver’s best “clean signal” indicators tend to be:
- Trend + volatility: price relative to moving averages, and whether pullbacks are shallow (bull) or deep (distribution).
- RSI divergence: silver frequently prints momentum divergences before sharp retracements; these don’t kill the bull market, but they often create 10–20% air pockets.
D) Silver Price Targets (Scenario-Based “Prediction”)
1–4 week horizon
- Base case: Retest of $82–$84, with a decent probability of a pullback to $76–$77.5 as the market digests gains.
- Bull case: Hold above ~$80 and break cleanly → advance toward $87.5–$95.
- Bear case: Lose $76–$77 decisively → slide toward $70–$72; if panic selling hits, the mid-$60s come into play.
3–6 month horizon
- Base case: Wide range trade between $70 and $95 (with sharp countertrend moves), unless macro conditions strongly favor metals.
- Bull case: A sustained breakout and weekly acceptance above ~$95 opens the door to a test of $100+ psychological zones.
- Bear case: A sustained break under ~$70 suggests a deeper unwind and higher odds of revisiting mid-$60s areas referenced in some analyses.
5) Gold vs. Silver: Relative Strength and What It Implies
A quick way to frame “which metal has the better setup” is to observe:
- Gold: typically the cleaner trend, lower volatility, more directly tied to rates/FX and central bank demand.
- Silver: higher beta, more “positioning + liquidity” driven, prone to squeezes and air pockets. Recent reporting even highlighted unusual volatility dynamics and liquidity issues contributing to big swings.
In practice:
- If you want trend stability, gold is usually the instrument.
- If you want momentum convexity, silver is the levered expression—but risk control becomes non-negotiable.
6) Practical Risk Framework (If You’re Trading These Levels)
Even long-term investors benefit from a technical risk overlay:
- Trade zones, not headlines. Metals can spike on risk news and then fade.
- Define invalidation.
- Gold bulls: sustained acceptance below $5,000 is your warning.
- Silver bulls: sustained breaks below $76–$77 raise probability of a deeper flush.
- Respect volatility. If your stop is too tight in silver, you’re not “disciplined”—you’re just donating to noise.
- Use timeframes that match your goal. A 1–4 week thesis shouldn’t be invalidated by a 10-minute wick unless you’re scalping.
7) Bottom Line: My “Prediction” in One View
Gold (XAU/USD)
- Bias: Uptrend intact, but watch consolidation dynamics.
- Key pivot: $5,100 – $5,105
- Near-term targets: then $5,345 if the breakout holds, upwards to $6K
- Downside risk zones: ~$4,842 then lower if trend damage occurs.
Silver (XAG/USD)
- Bias: Bullish structure, elevated mean-reversion risk.
- Key supports: $76–$77.5, then $70–$72
- Upside zones: $87.5–$95, then psychological $100+ if momentum persists.