

The Current State of Ethereum (ETH)
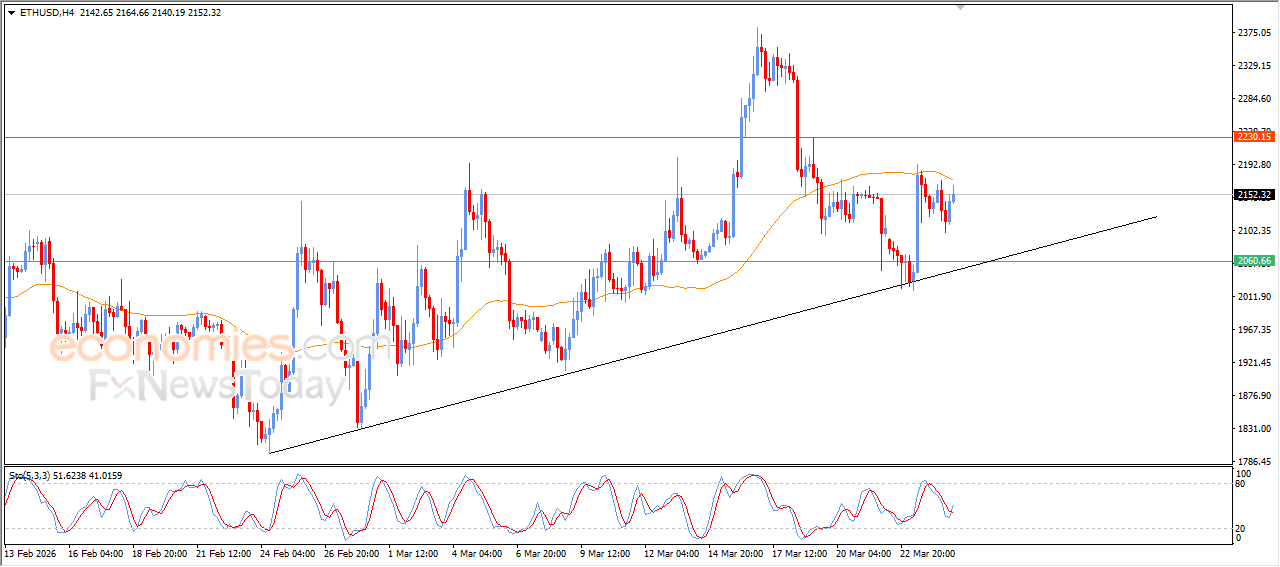


As of March 28, 2026, Ethereum (ETH) is trading around the $2,000 level, sitting at a critical inflection point. After a period of volatility and lower highs, the market is now compressing into what appears to be a decision zone.
This type of price behavior is not random. It reflects a balance between buyers and sellers—often preceding a major move.
Right now, Ethereum price action is defined by:
- A recent downtrend
- Strong support around $2,000
- Resistance near $2,100–$2,200
- Decreasing volatility
This combination suggests that the market is preparing for a breakout—but the direction is not yet confirmed.
Understanding the Current Market Structure


From a technical standpoint, Ethereum is currently forming a lower high structure, which is typically associated with bearish continuation.
However, there is an important nuance:
- Price is no longer aggressively dropping
- Selling pressure is weakening
- Buyers are defending key levels
This creates a hybrid structure where both bearish continuation and bullish reversal are possible.
Two Competing Narratives:
Bearish Case:
- Lower highs remain intact
- Price still below major moving averages
- Potential continuation downward
Bullish Case:
- Strong support holding
- Momentum beginning to shift
- Compression suggests accumulation
This is why the current range is so important—it determines the next phase of the trend.
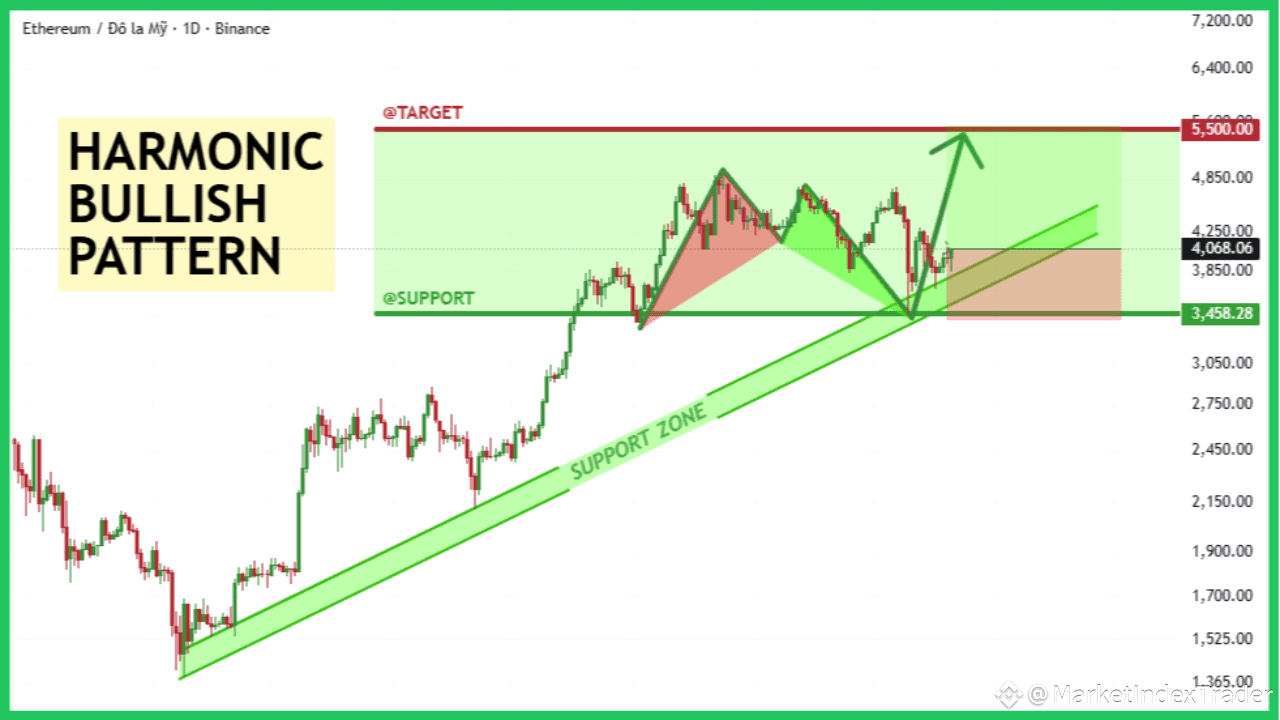
Key Support and Resistance Levels


Understanding key levels is essential for predicting price movement.
🟢 Support Zones:
- $2,000 → Psychological + structural support
- $1,950–$1,980 → Recent demand zone
- $1,800–$1,850 → Major macro support
🔴 Resistance Zones:
- $2,050–$2,100 → Immediate resistance
- $2,200–$2,300 → Breakout target zone
- $2,500 → Higher timeframe resistance
Right now, Ethereum price prediction hinges on whether price holds above or breaks below $2,000.
Is There a Bear Flag Forming?
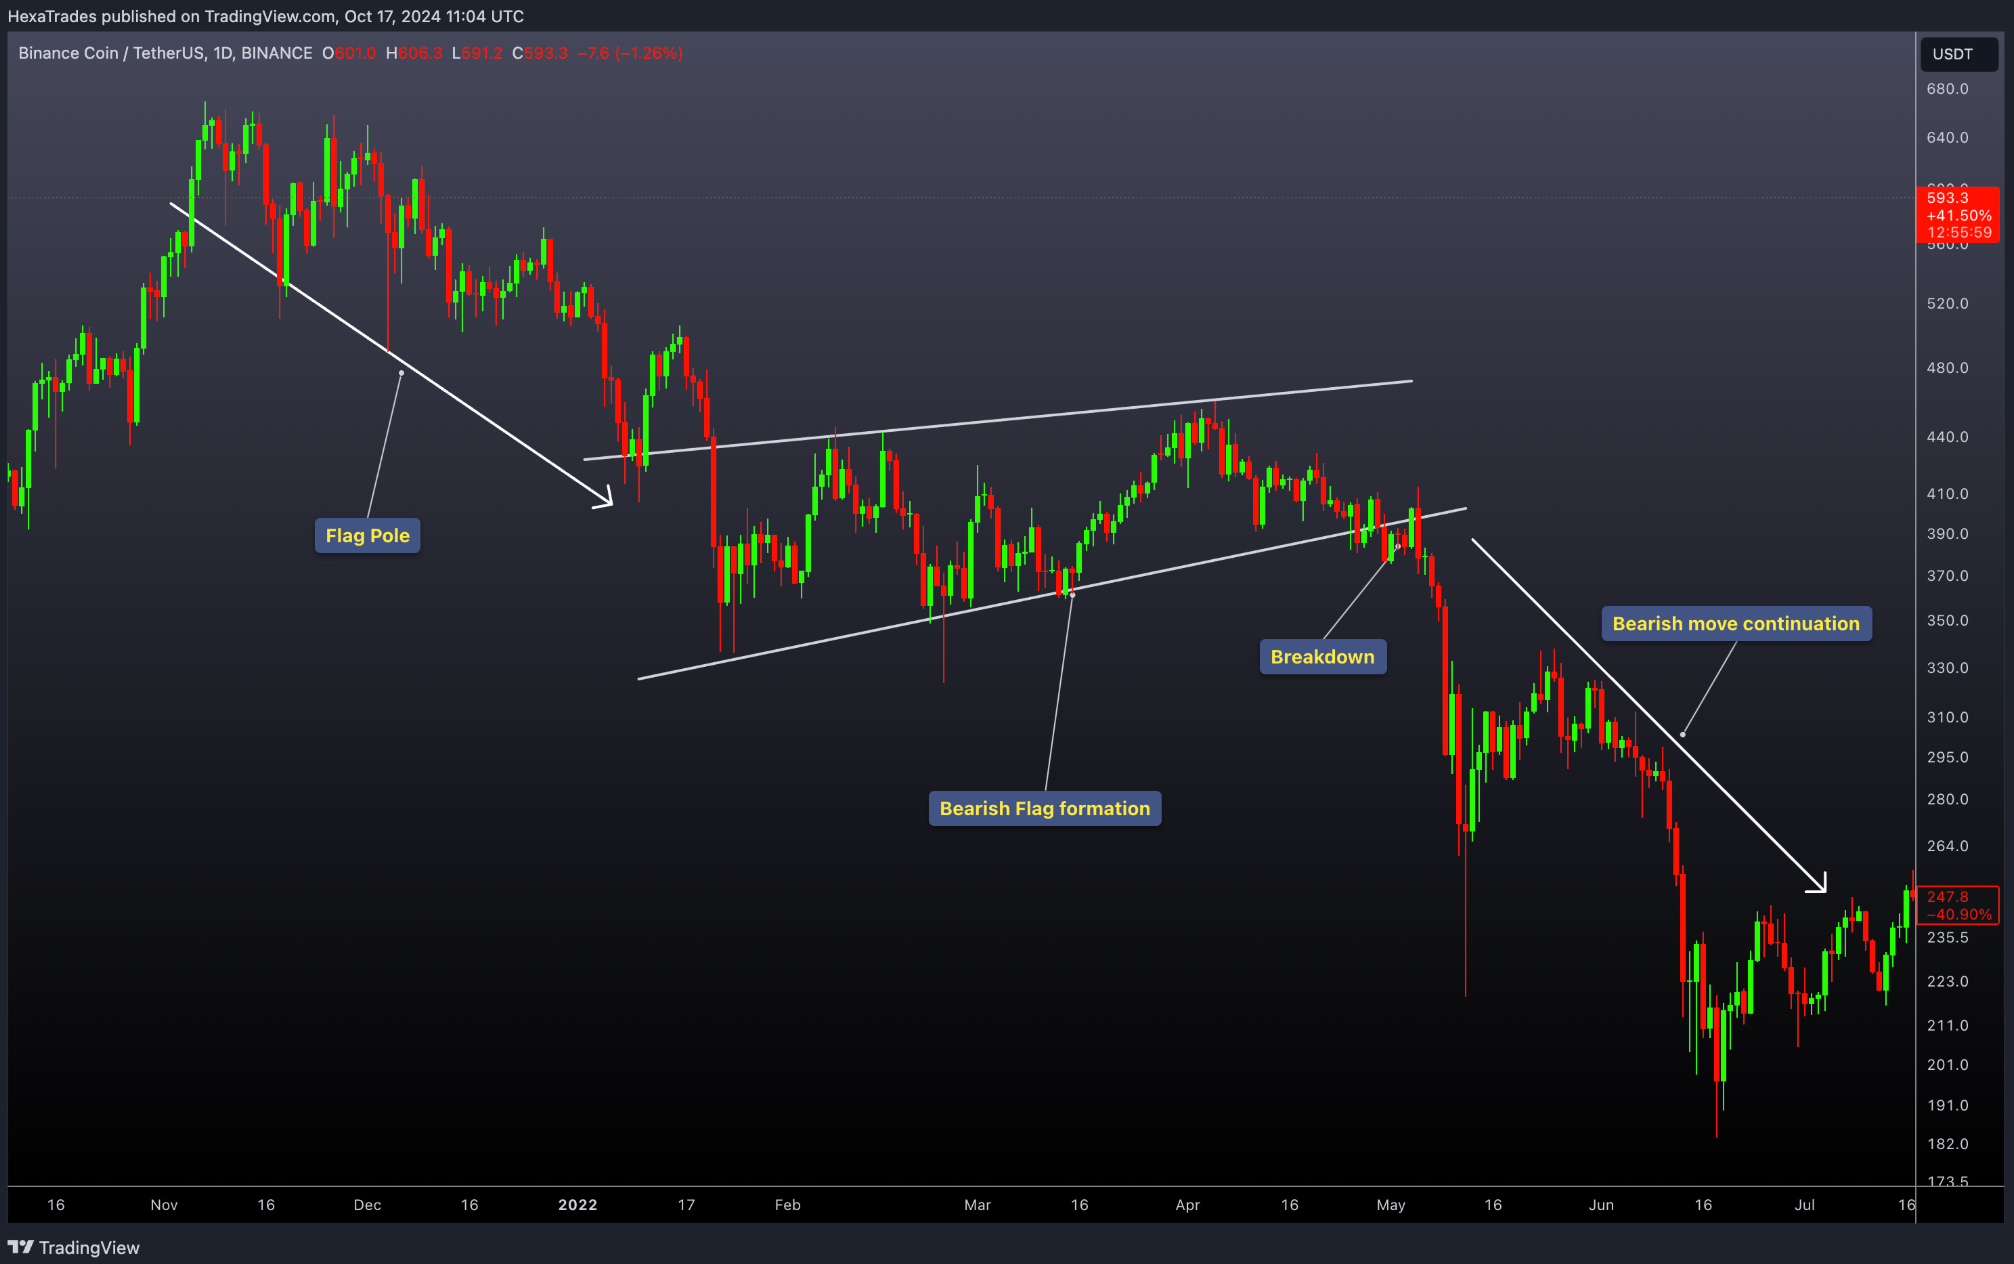
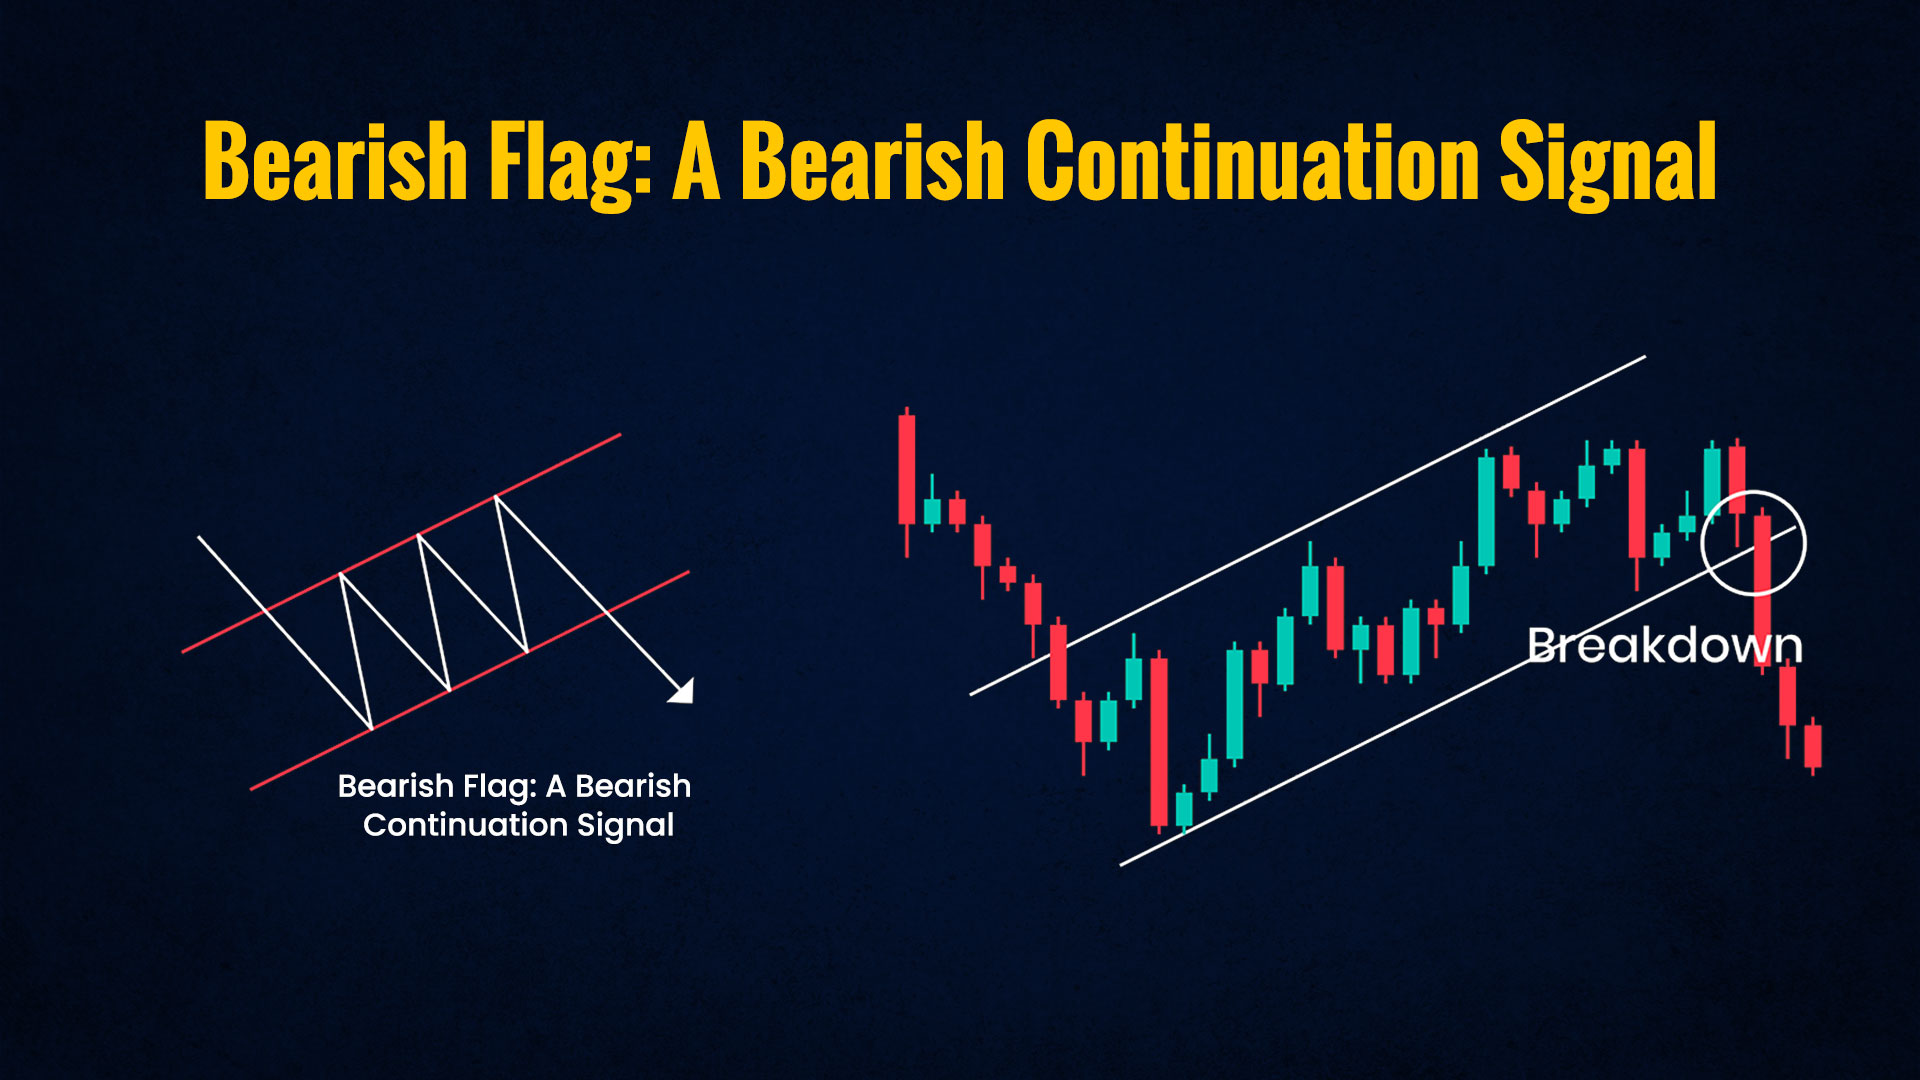
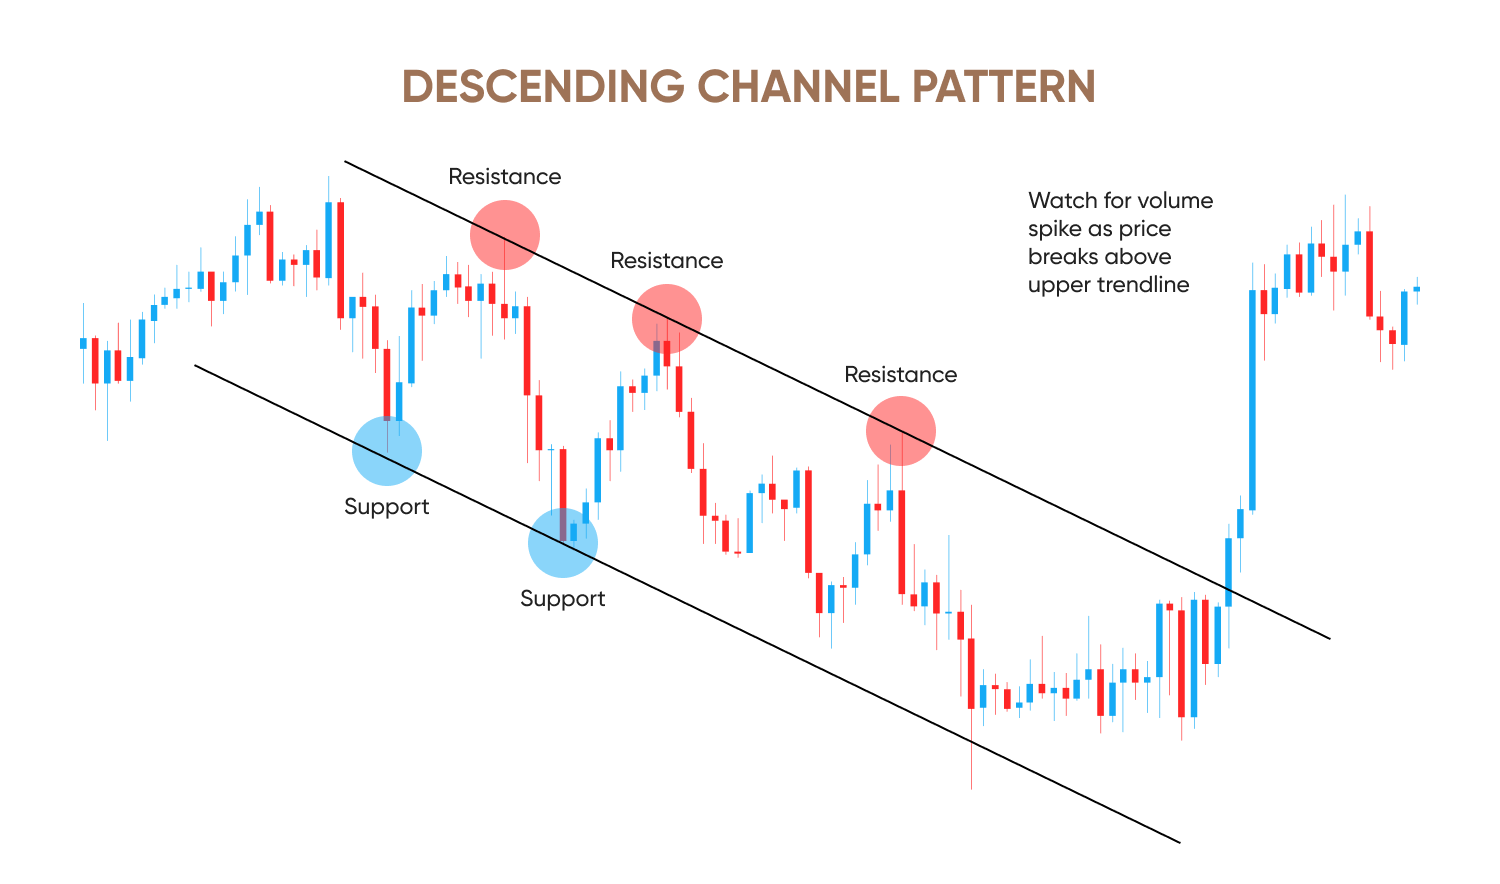
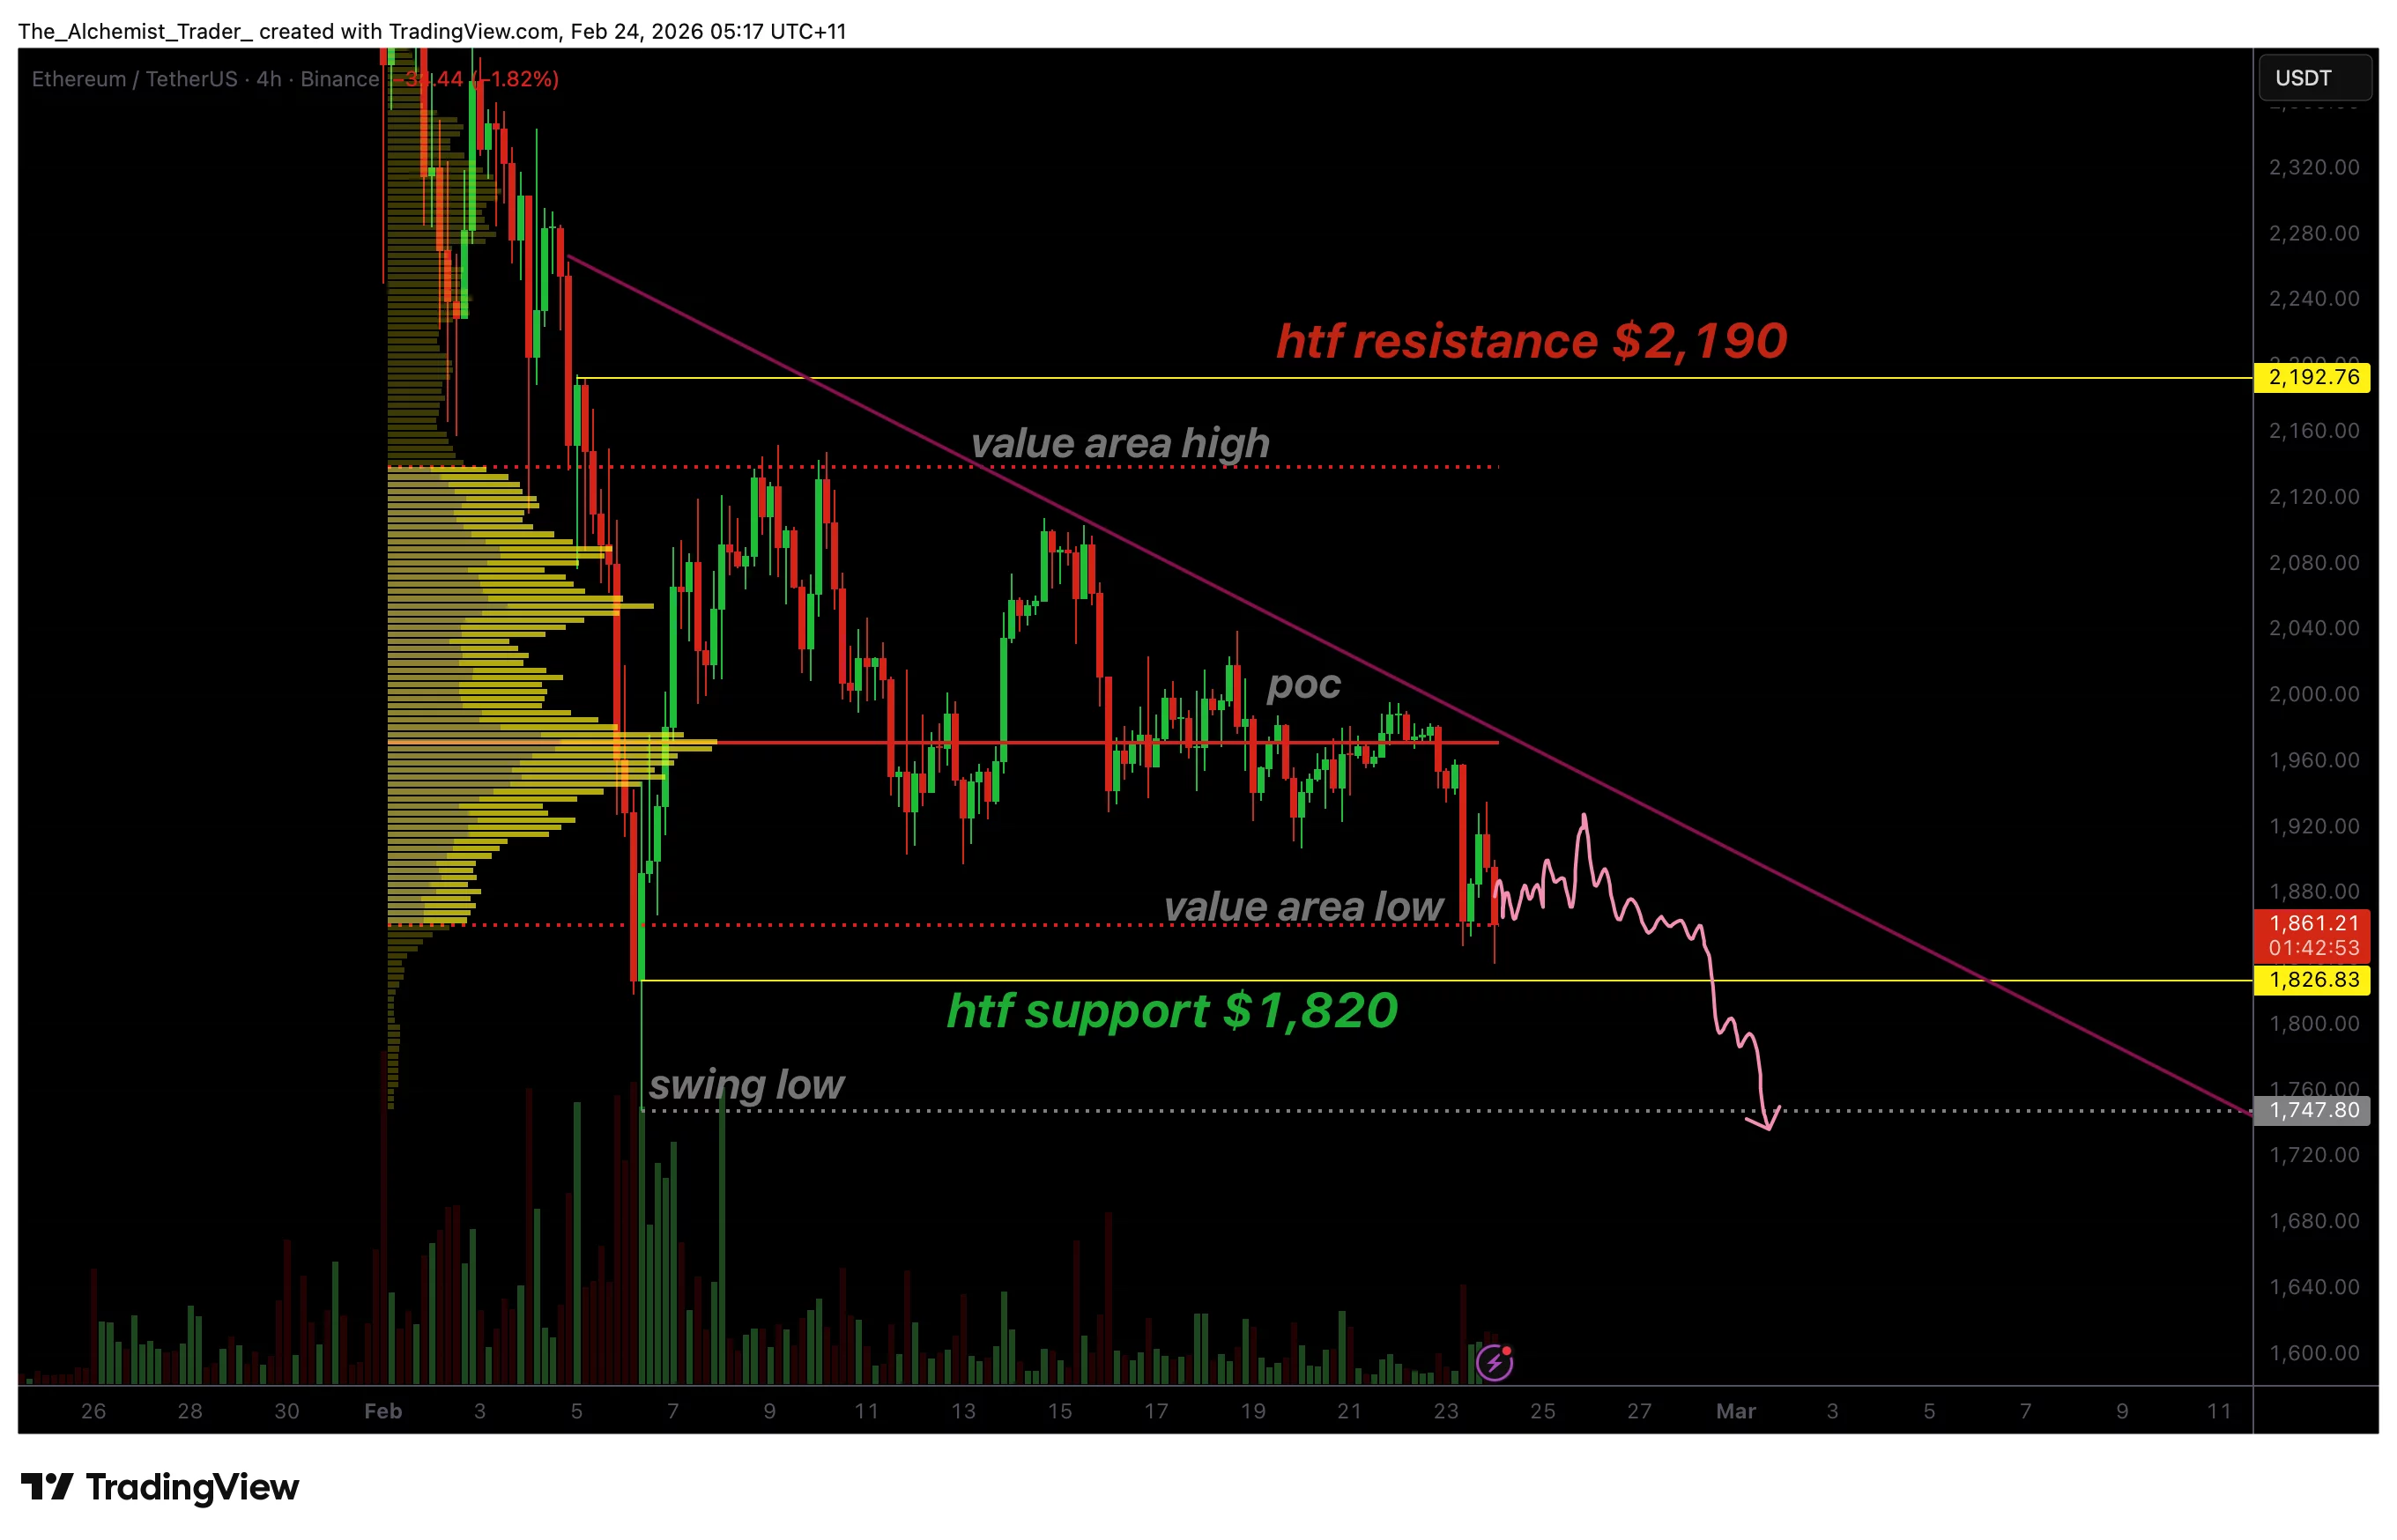
One of the most important patterns currently forming is a potential bear flag.
Structure Breakdown:
- Flagpole: Sharp drop from ~$2,350 to ~$2,050
- Flag: Sideways consolidation with slight upward drift
- Volume: Decreasing during consolidation
This is a textbook bearish continuation pattern—but it is not confirmed yet.
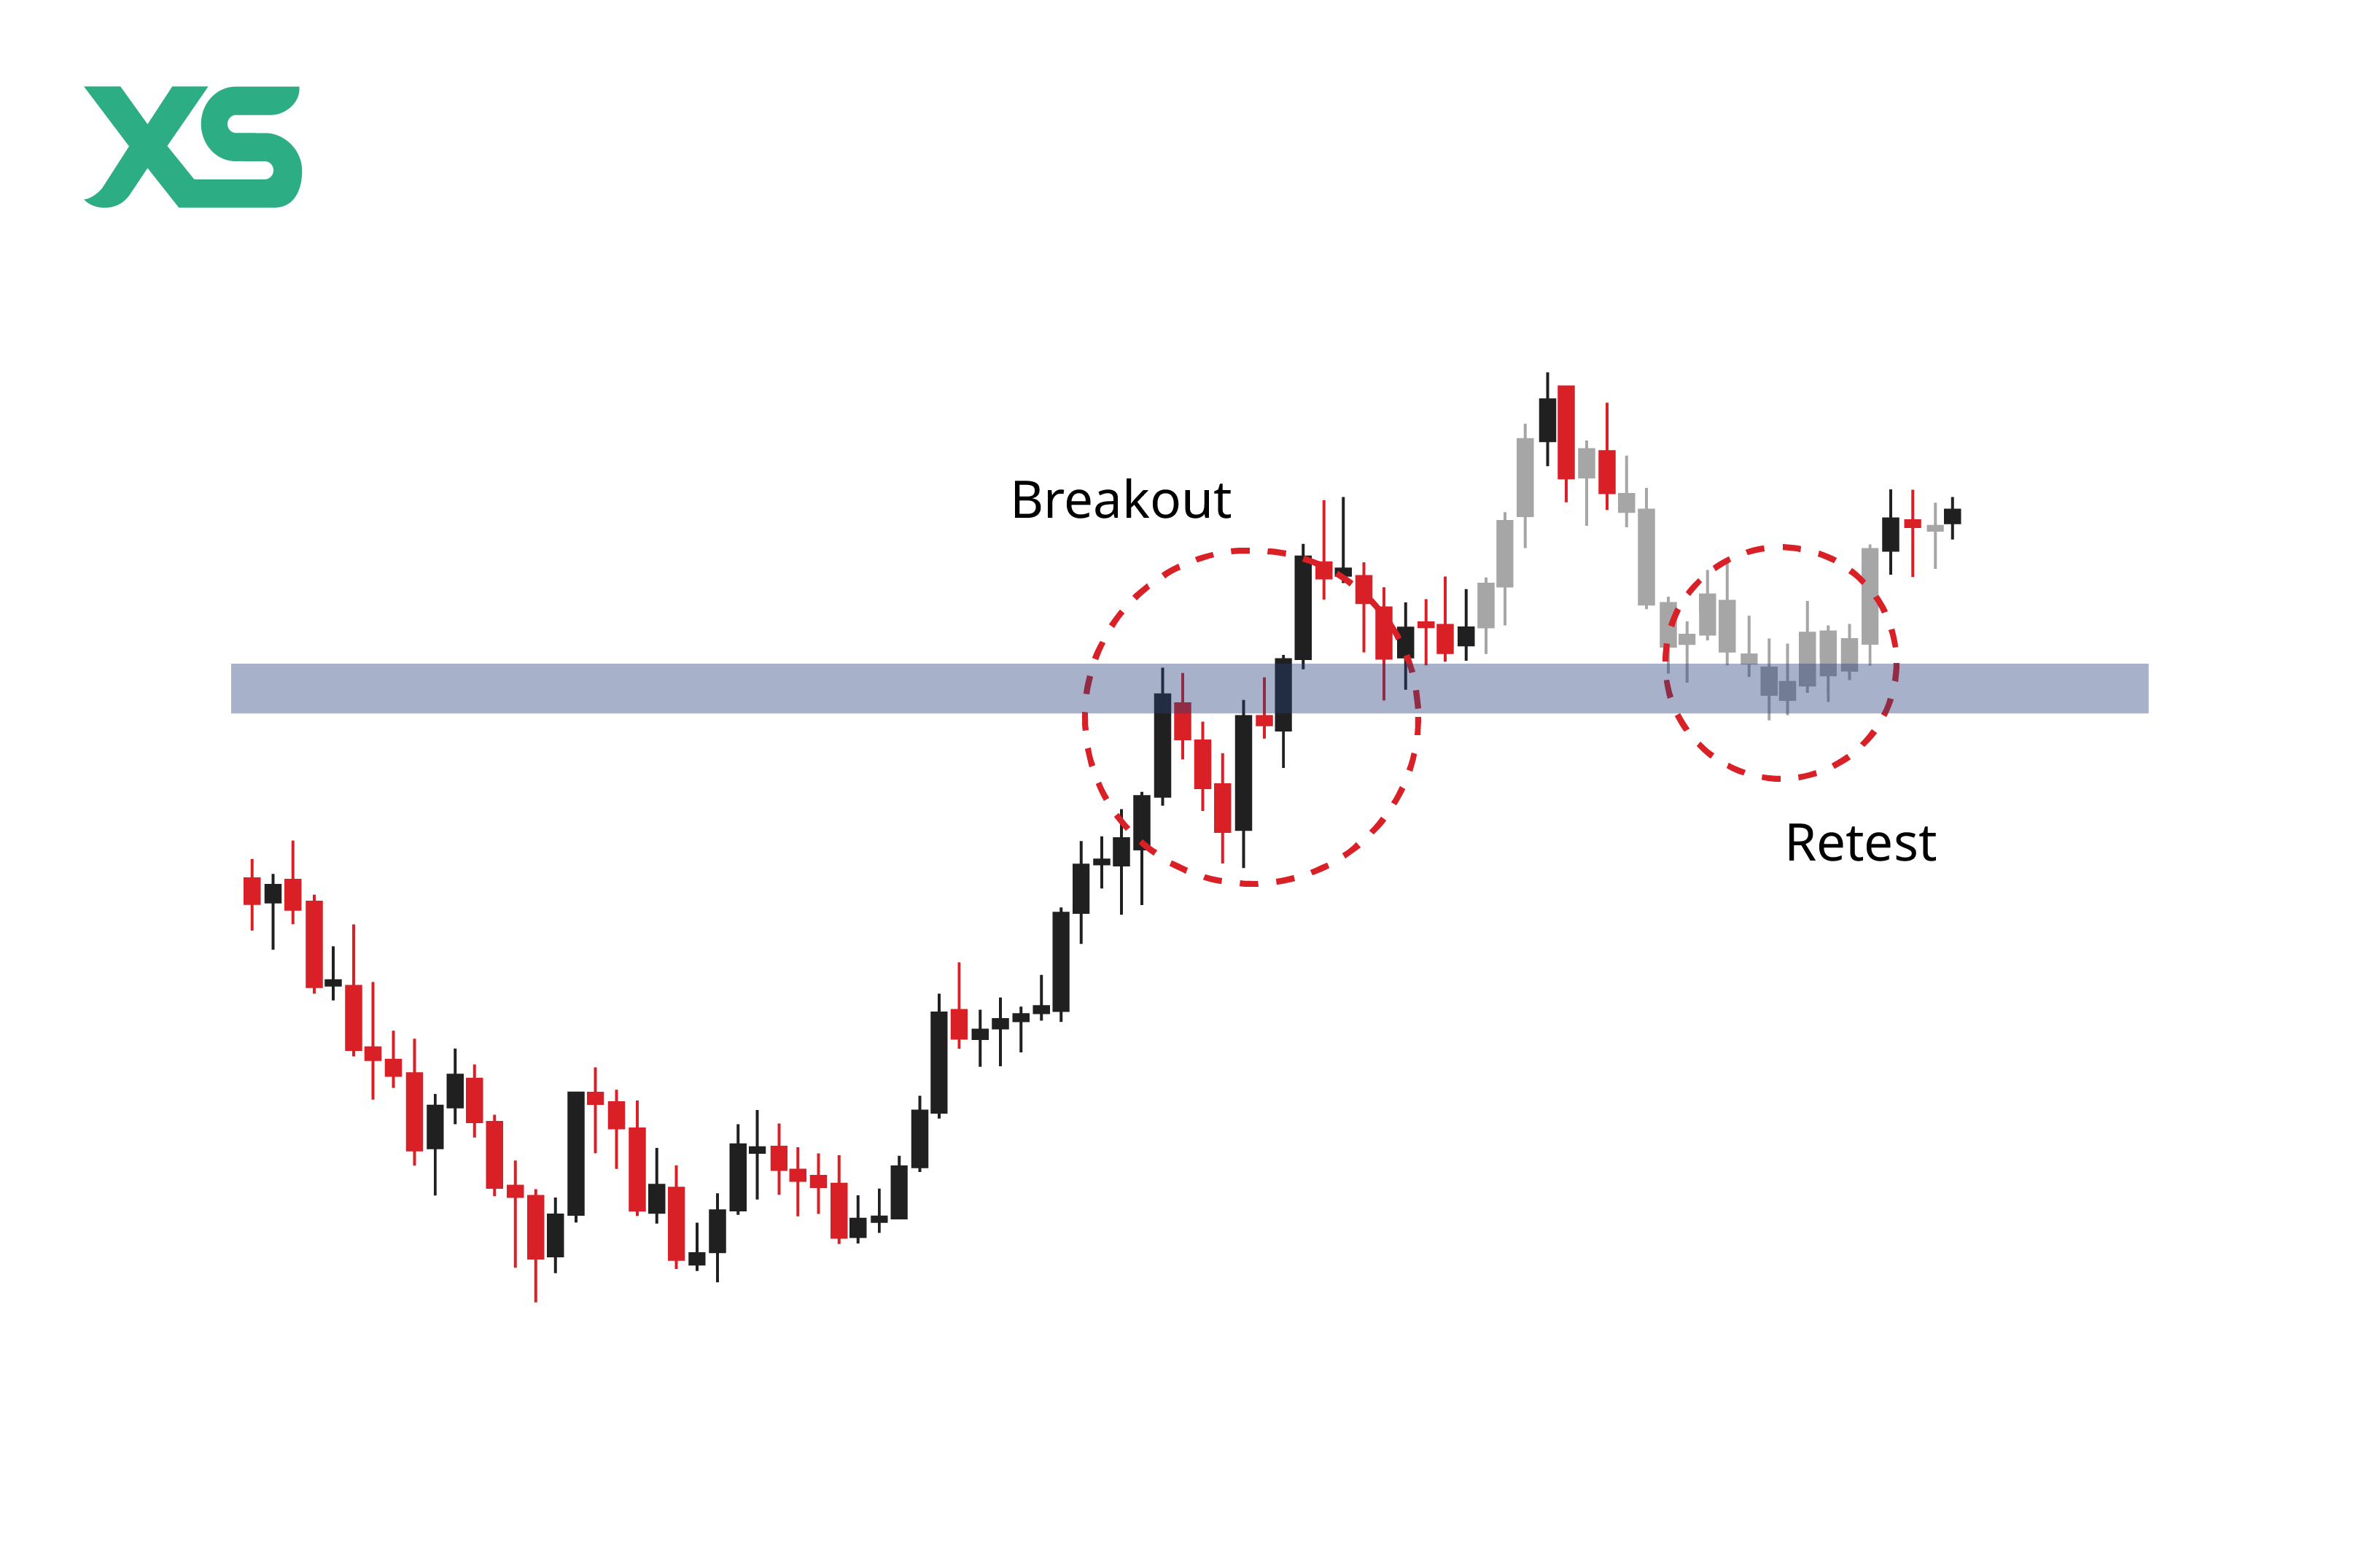
Confirmation Trigger:
- Breakdown below $2,000
Target (if confirmed):
- $1,750–$1,800
However, if price breaks above resistance instead, the pattern is invalidated—leading to a bullish reversal scenario.
Momentum Indicators: What Are They Saying?


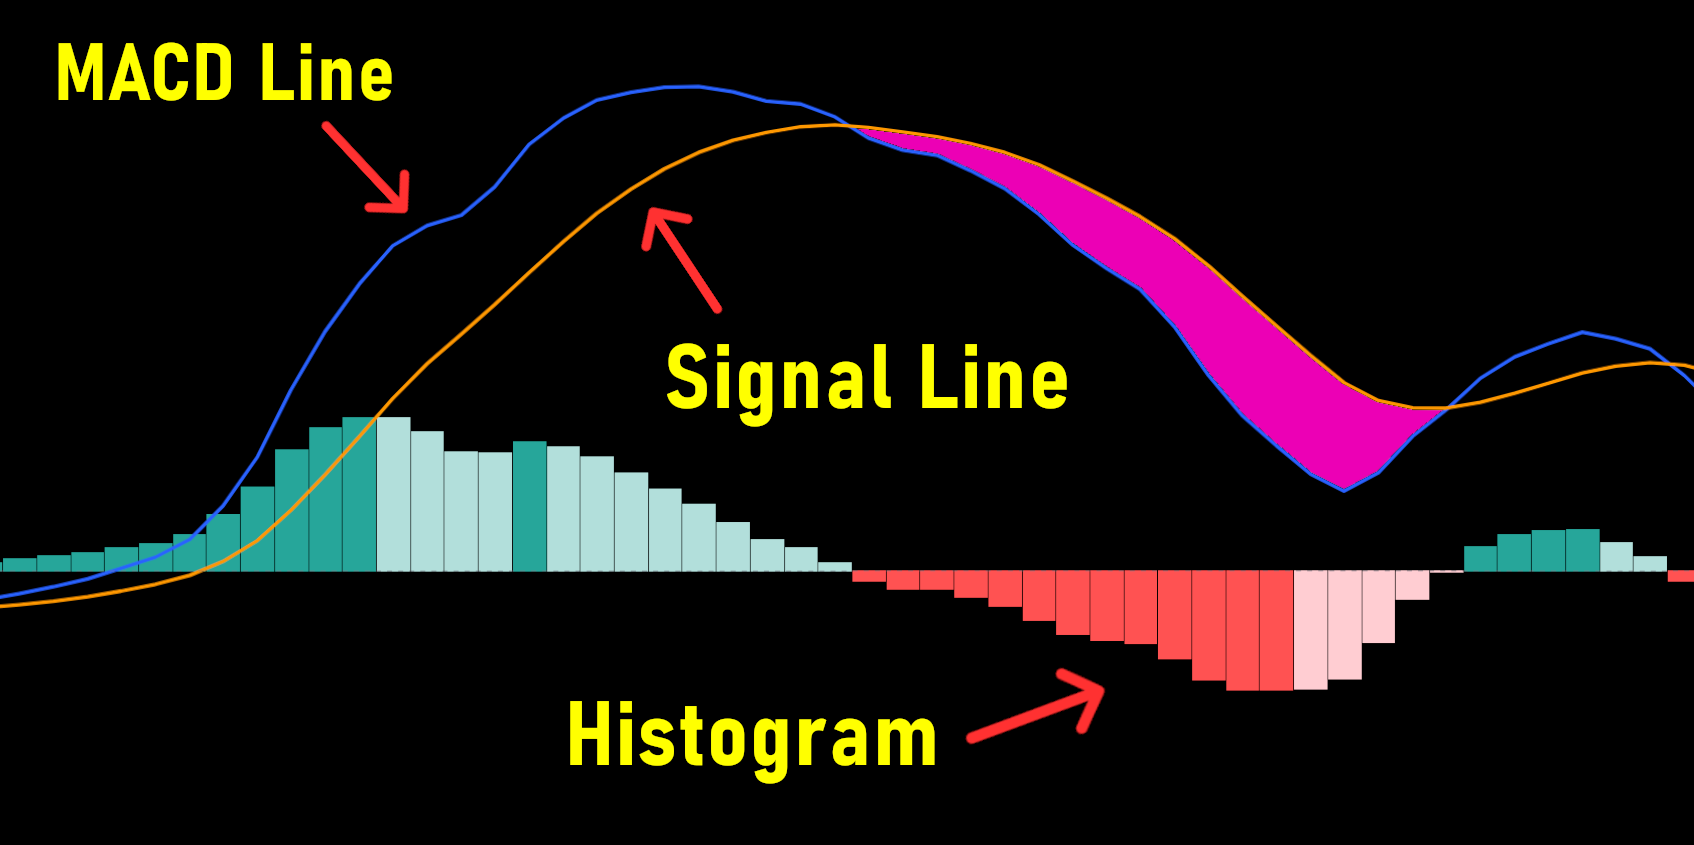
Momentum indicators are starting to shift—but not decisively.
Key Signals:
- MACD:
- Showing early bullish crossover
- Suggests momentum shift
- Moving Averages:
- Price near 50 SMA (support)
- Still below 200 SMA (resistance)
- Volume:
- Declining → typical of consolidation
Interpretation:
This is a transition phase.
Momentum is no longer strongly bearish—but it hasn’t turned fully bullish either.
Short-Term Ethereum Price Prediction (1–7 Days)

🟢 Bullish Scenario:
If Ethereum:
- Holds above $2,000
- Breaks above $2,100
➡️ Target:
- $2,200 → $2,350
This would signal:
- Trend reversal
- Increased buying momentum
- Potential continuation upward
🔴 Bearish Scenario:
If Ethereum:
- Breaks below $2,000
➡️ Target:
- $1,950 → $1,800
This aligns with:
- Bear flag breakdown
- Continuation of lower highs
🟡 Neutral Scenario:
If price remains between:
- $2,000–$2,100
➡️ Expect:
- Choppy sideways action
- False breakouts
- Liquidity traps
The Role of Market Psychology

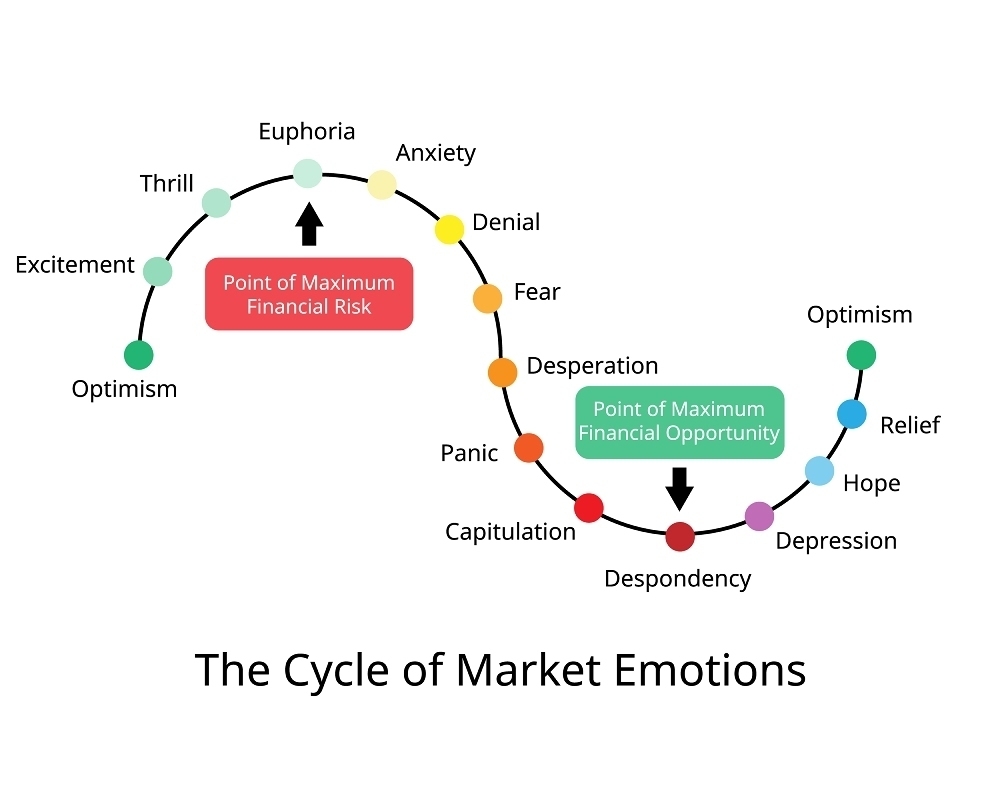
Markets are driven as much by psychology as they are by data.
Right now, Ethereum is in a phase of:
- Uncertainty
- Low conviction
- Positioning
This is often referred to as accumulation or distribution.
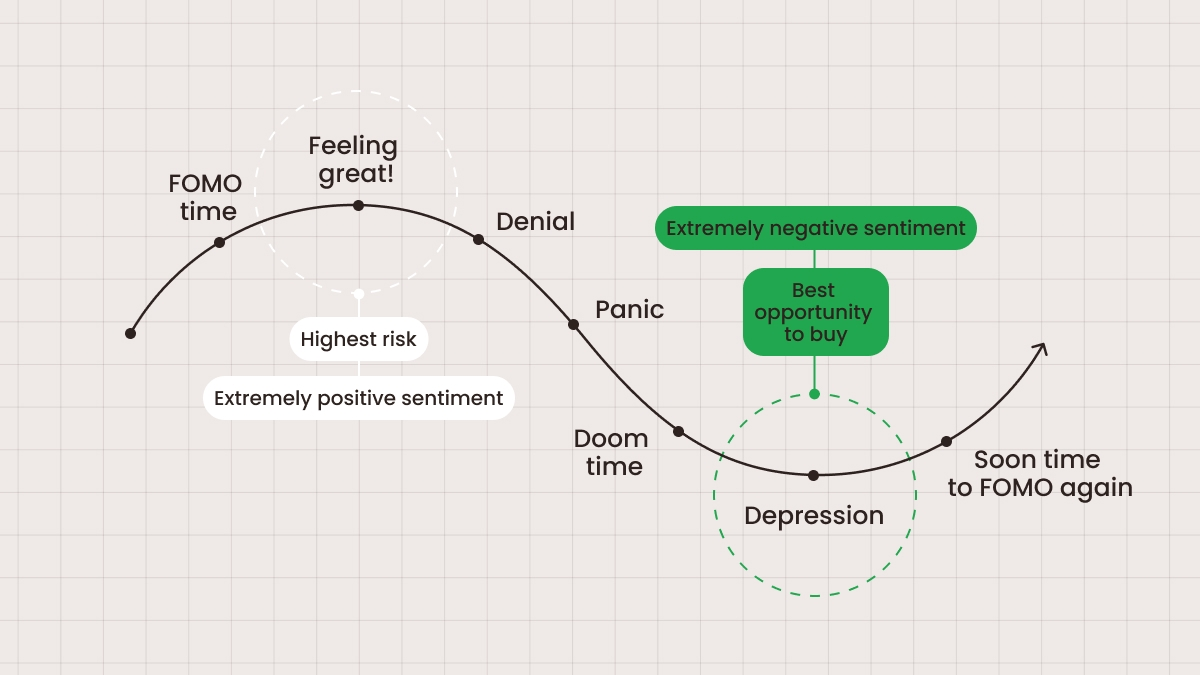
What Happens Next:
- If buyers step in → breakout
- If sellers regain control → breakdown
This is why consolidation phases are so important—they build the energy for the next move.
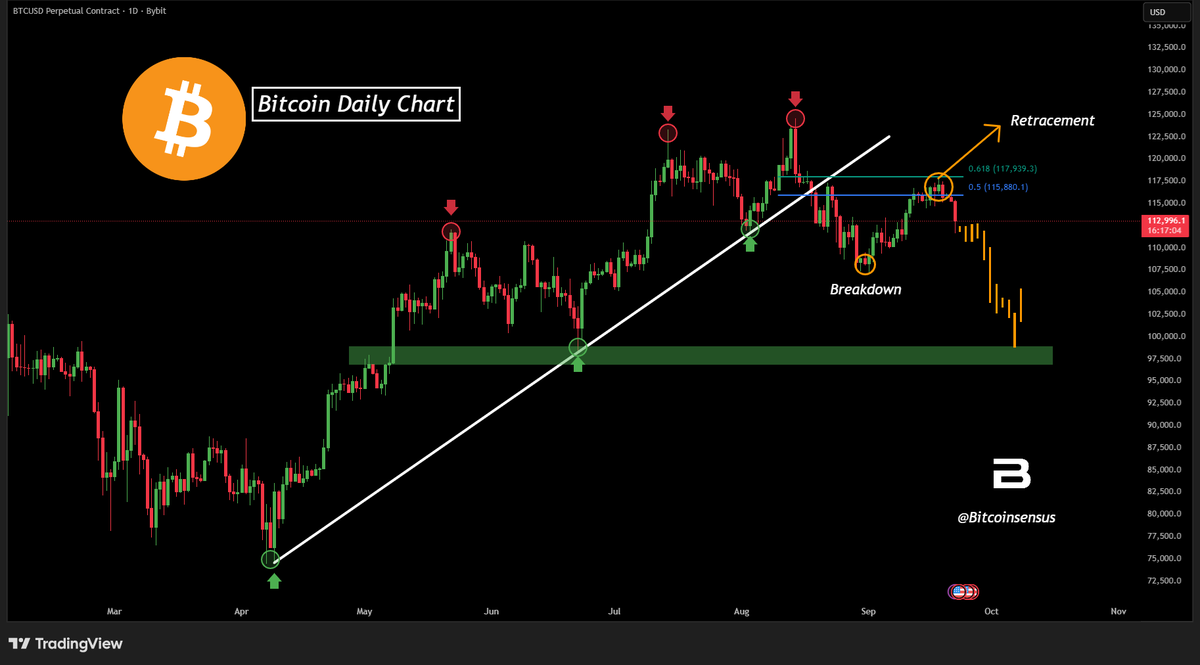
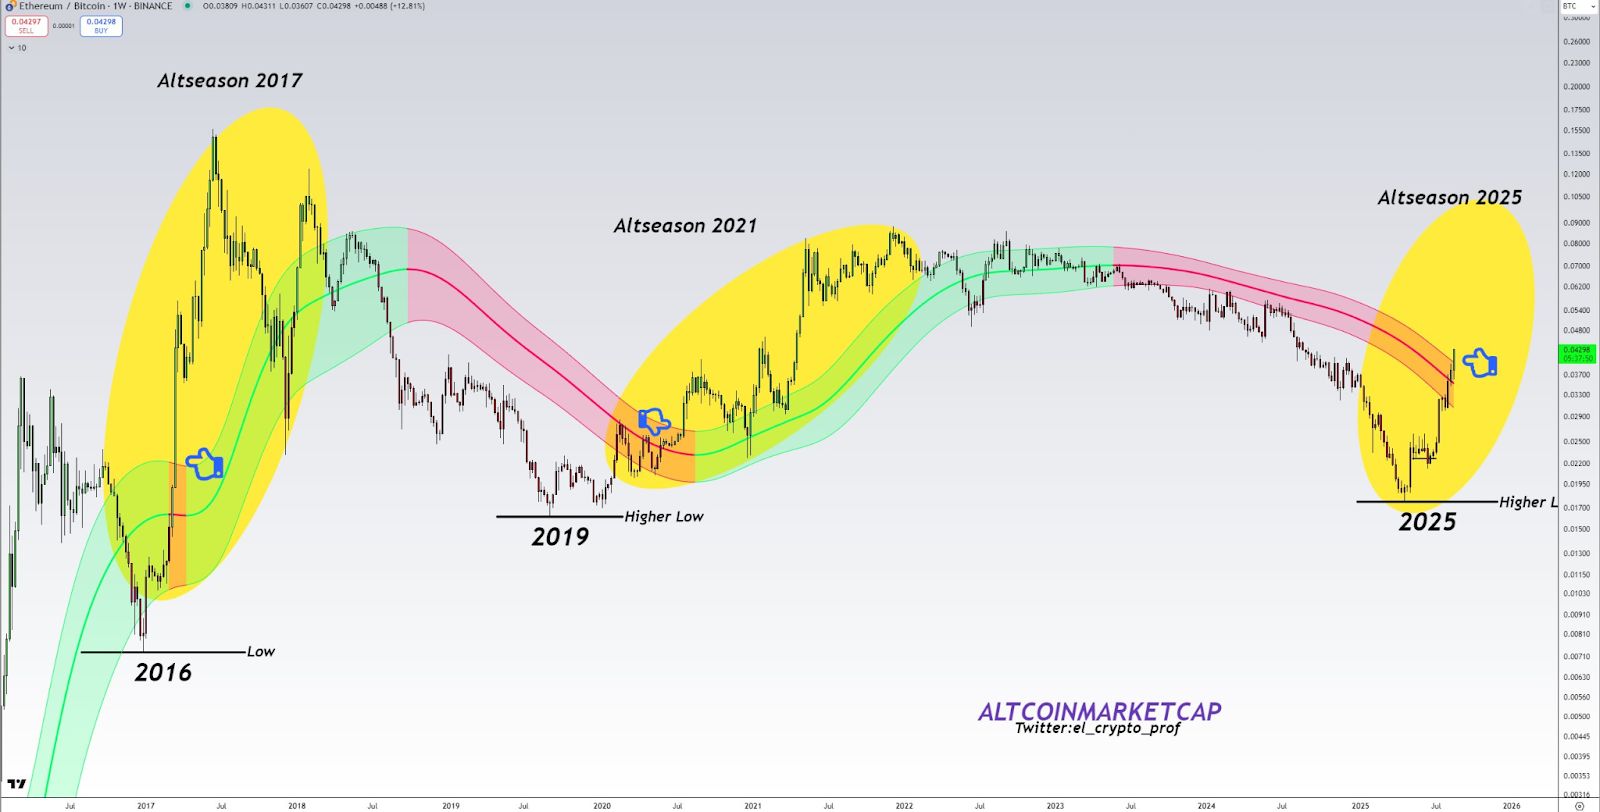
Macro Factors Influencing Ethereum

Beyond technicals, Ethereum price prediction is heavily influenced by macro conditions.
Key Drivers:
- Global liquidity
- Interest rate expectations
- Risk appetite in financial markets
- Bitcoin’s performance
Crypto tends to perform best in risk-on environments, where capital flows into higher-risk assets.
If liquidity expands:
➡️ Crypto rises
If liquidity tightens:
➡️ Crypto struggles
Mid-Term Ethereum Price Prediction (1–3 Months)

🟢 Bull Case:
- Break above $2,300
- Momentum builds
➡️ Target:
- $2,800 → $3,200
🔴 Bear Case:
- Lose $2,000 support
- Continued lower highs
➡️ Target:
- $1,700–$1,800
🟡 Base Case:
- Continued range
➡️ Range:
- $2,000–$2,500
This is currently the most likely scenario until a breakout occurs.
Final Thoughts on Ethereum Price Prediction 3/28/26
Ethereum is at a critical decision point.
The market is:
- Compressing
- Building liquidity
- Waiting for direction
The key takeaway is simple:
- Above $2,100 → bullish
- Below $2,000 → bearish
- Between → indecision
This is not a time for aggressive positioning—it is a time for observation and preparation.
Because once the breakout happens…
it will likely be fast.
Bottom Line
The current Ethereum price prediction is not about guessing direction—it’s about identifying key levels and reacting accordingly.
- Watch $2,000 support
- Watch $2,100 resistance
- Watch volume on breakout
Because in crypto, the biggest moves don’t happen during noise…
they happen when the market finally decides.