

Cryptocurrency markets operate 24 hours a day, but some of the most volatile and tradable moments occur when traditional financial markets open. In particular, the NYSE open at 9:30 AM EST often triggers sudden movements in Bitcoin, Ethereum, and other major cryptocurrencies.
Many professional traders avoid trading during the first few minutes of the session and instead wait for the market to establish an initial range. After the first 15 minutes pass, new opportunities often emerge as price reacts to the opening range high and low.
One of the most effective ways to trade this volatility is by using candlestick patterns that signal reversals or momentum shifts. Patterns like the hammer candle, bullish engulfing candle, bearish engulfing candle, and inside bar breakout can provide clear signals for entering quick scalp trades.
In this guide, we’ll explore how traders use these patterns to identify high-probability setups when scalping crypto after the first 15 minutes of the NYSE open.
Why the First 15 Minutes of the NYSE Open Matter


The opening of the U.S. stock market is one of the most important moments in global finance. Although cryptocurrencies are not tied directly to stock exchanges, they often react strongly to the increase in institutional trading activity.
During this period:
- Institutional traders begin executing positions
- Macro news and economic reports influence risk assets
- Large trading algorithms enter the market
- ETF flows impact Bitcoin liquidity
Because of these factors, crypto volatility often increases sharply between 9:30 AM and 10:30 AM EST.
Many experienced traders allow the first 15 minutes of trading to establish what is known as the opening range. This range forms the foundation for many short-term trading strategies.
Understanding the Opening Range Strategy

The opening range is defined as the high and low that form during the first 15 minutes after the market opens.
These levels create two important zones:
- Opening range high
- Opening range low
These levels often act as short-term support and resistance. After 9:45 AM EST, traders watch how price reacts when approaching these levels.
A common pattern occurs when price briefly breaks above or below the range, triggers stop losses, and then reverses direction. This phenomenon is often called a liquidity sweep or stop hunt.
This is where candlestick patterns become extremely useful. Certain formations can indicate that the market is about to reverse or continue its move.
The Hammer Candle for Reversal Scalps


One of the most reliable signals during intraday trading is the hammer candle.
A hammer candle forms when price moves significantly lower but buyers step in and push the price back toward the candle’s opening level.
The pattern typically includes:
- A small candle body
- A long lower wick
- Very little upper wick
- A formation after a downward move
This structure shows that sellers attempted to push the market lower but were unable to maintain control.
During crypto scalping after the NYSE open, a hammer candle appearing near the opening range low can signal a potential reversal.
Entry Method
Many traders wait for confirmation before entering the trade.
A common entry is:
- Enter above the high of the hammer candle
Stop Loss
The stop loss is usually placed:
- Below the low of the hammer candle
Profit Targets
Common scalp targets include:
- The opening range midpoint
- VWAP
- The opening range high
The Bullish Engulfing Candle for Momentum Reversals


Another powerful pattern used by traders is the bullish engulfing candle.
This pattern occurs when a strong bullish candle completely engulfs the body of the previous bearish candle.
Key characteristics of a bullish engulfing candle include:
- A large bullish body
- The candle closes above the previous candle
- The candle appears after a short downward move
This pattern often signals that buyers have taken control of the market.
When a bullish engulfing candle appears near a key support level or after a liquidity sweep below the opening range, it can trigger strong upward momentum.
Entry Strategy
Many traders enter the trade when:
- Price breaks above the high of the engulfing candle
Stop Loss
Stops are typically placed:
- Below the engulfing candle low
Targets
Traders often target:
- VWAP
- Opening range high
- Nearby resistance levels
The Bearish Engulfing Candle for Short Scalps


While many traders focus on bullish reversals, short opportunities also appear frequently during the morning session.
A bearish engulfing candle occurs when a large red candle fully engulfs the previous bullish candle.
Key features include:
- A strong bearish candle
- The candle body fully covers the prior candle
- The pattern forms after a short upward move
During crypto trading after the NYSE open, this pattern often appears when price briefly breaks above the opening range high and then quickly reverses.
Entry Strategy
A common entry is:
- Enter below the low of the bearish engulfing candle
Stop Loss
Stops are typically placed:
- Above the candle high
Profit Targets
Short scalp targets include:
- Opening range midpoint
- VWAP
- Opening range low
The Inside Bar Breakout Pattern
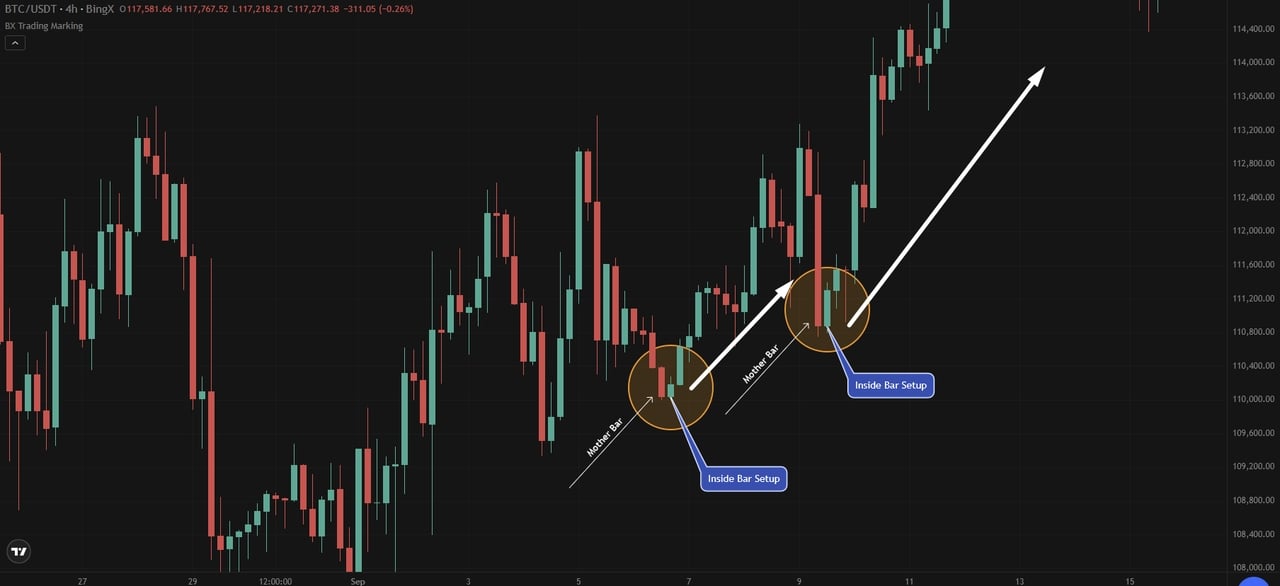

The inside bar pattern is another useful setup for traders looking to capture quick momentum moves.
An inside bar forms when a candle’s high and low remain completely within the range of the previous candle.
This pattern represents market consolidation, where volatility temporarily contracts before expanding again.
After the first 15 minutes of the NYSE open, inside bars often appear as the market pauses before choosing a direction.
Entry Strategy
Traders typically place orders:
- Above the inside bar high for bullish breakouts
- Below the inside bar low for bearish breakouts
Stop Loss
Stops are commonly placed:
- On the opposite side of the inside bar
Profit Targets
Scalp traders often aim for:
- 1:2 risk-to-reward
- Nearby support or resistance levels
Combining Candlestick Patterns with VWAP
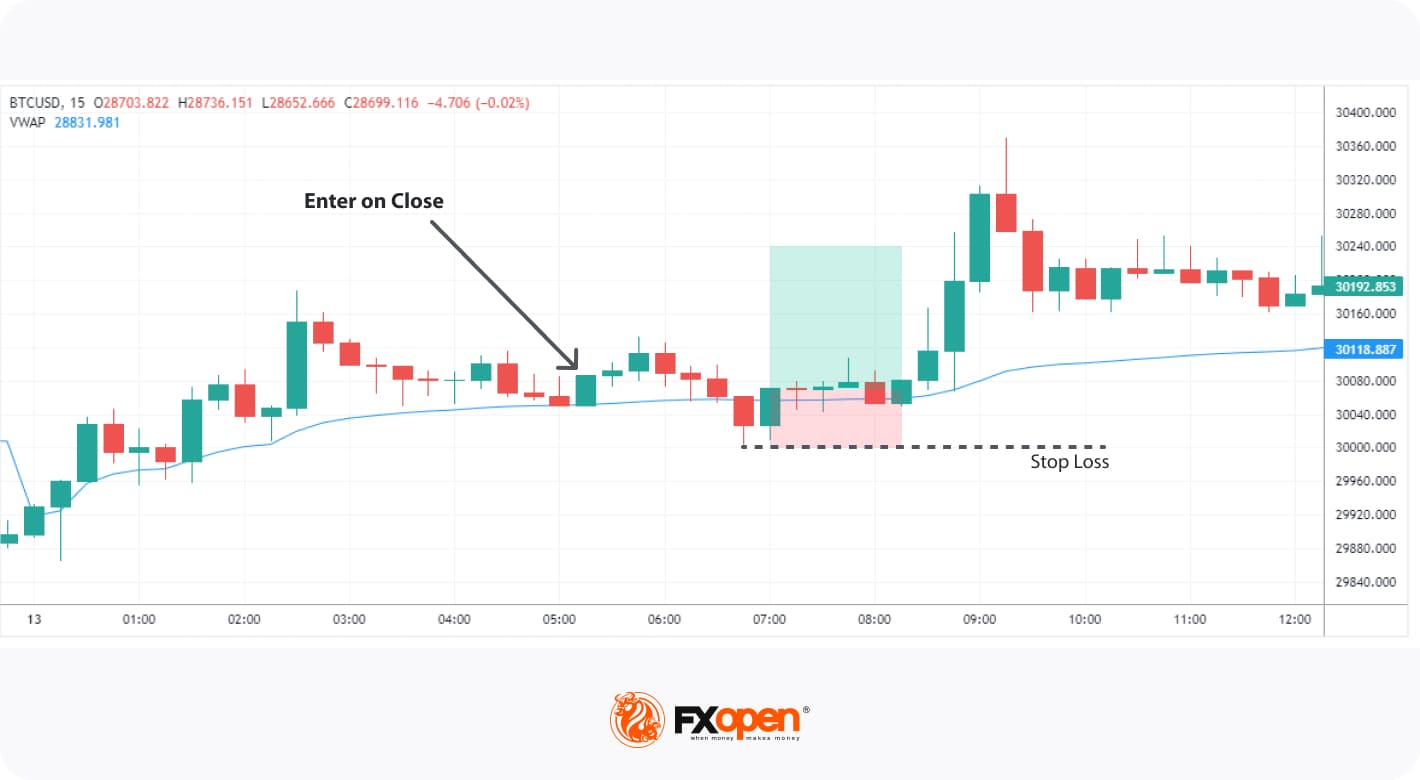

Many professional traders combine candlestick patterns with additional indicators to increase the probability of success.
One of the most commonly used tools is VWAP (Volume Weighted Average Price).
VWAP represents the average price traded throughout the session and often acts as dynamic support or resistance.
For example:
- A hammer candle forming near VWAP can signal a strong support bounce
- A bearish engulfing candle above VWAP may indicate a rejection
When candlestick patterns align with VWAP and opening range levels, the probability of a successful scalp often increases.
Risk Management for Crypto Scalping

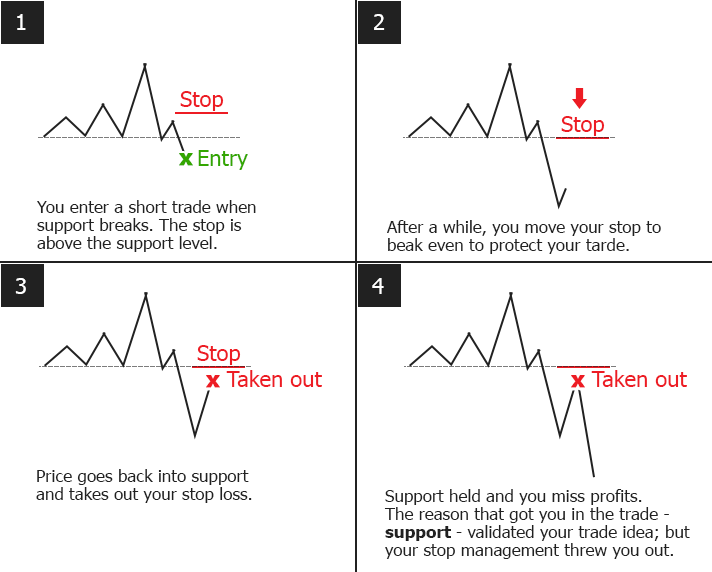
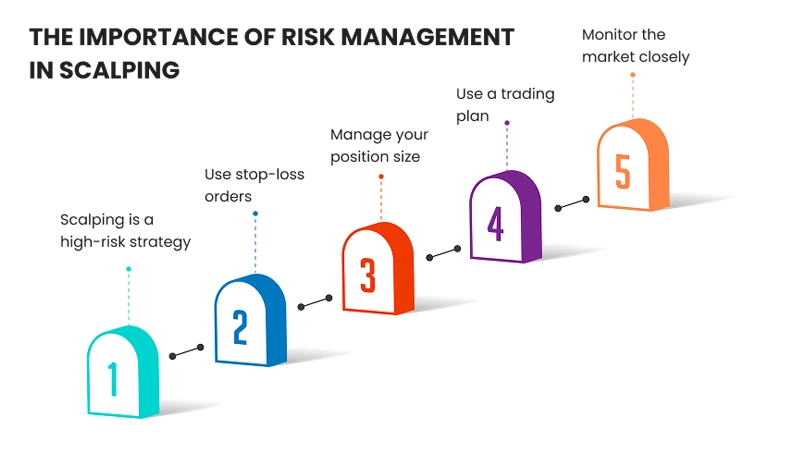
Even the best patterns can fail, which is why risk management is critical.
Professional traders follow strict rules when scalping crypto.
Some common guidelines include:
- Risk no more than 0.25% to 1% of capital per trade
- Maintain a minimum risk-to-reward ratio of 1:2
- Avoid overtrading during high volatility
- Always use a stop loss
By maintaining consistent risk management, traders can remain profitable even when some setups fail.
Final Thoughts
Trading crypto after the first 15 minutes of the NYSE open can provide some of the most exciting opportunities of the day. The increase in liquidity and institutional participation often leads to sharp price movements that skilled traders can capitalize on.
By watching for hammer candles, bullish engulfing candles, bearish engulfing candles, and inside bar breakouts, traders can identify clear entry points for short-term scalp trades.
When these patterns occur near key levels such as VWAP or the opening range high and low, the probability of success increases even further.
With patience, discipline, and strong risk management, these candlestick trading patterns can become powerful tools for navigating the fast-moving crypto market.