
Over the past few weeks this series has covered Bollinger Bands, RSI, the MACD, moving averages and volume, one at a time. Each one is useful. But knowing five indicators is not the same as having a way of trading. The real question is: what do I actually do when I open a chart?
This post is the answer I would give. It is a five-layer checklist — bias, setup, momentum, volume, risk — where every layer asks one question and no two layers ask the same one. I will walk through each layer, show how the 1-2-3 Money Scanner finds candidates for it using a real scan, and give you a simple scoring rule for deciding how big to go, or whether to skip the trade entirely.
What this is and is not. It is a framework for making consistent decisions, built from the standard tools covered in this series. It is not a guarantee, not a signal service and not financial advice. No system removes losing trades — the point is to take fewer low-quality ones and to lose small when you are wrong.
The Principle — One Question Per Indicator
The most common way traders sabotage themselves with indicators is to stack five that all say the same thing. Two oscillators, three moving averages and a trend line are really one signal wearing five costumes — they agree because they are all derived from the same price, so their agreement tells you almost nothing.
The fix is to give each tool a single, separate job:
Notice that RSI and MACD share a layer on purpose. They are both momentum tools, but they do different work inside it: RSI measures strength (and warns through divergence), while MACD measures acceleration (through the histogram and crossovers). Used together they confirm each other; used as two separate “signals” they would double-count.
The Five Layers in Detail
1
Bias — decide which side you are allowed to trade
Start on the daily chart. Price above a rising 200 SMA — you only look for longs. Price below a falling 200 SMA — you only look for shorts. If price is tangled around a flat 200 with the 20 and 50 bunched together, there is no bias, and you either use range tactics or stand aside. This single filter removes most of the trades that fight the larger trend, which are the ones that hurt most.
Pass: a clear bias you can state in one sentence. Fail: no clear bias, or the setup you want is against it.
Pass: a clear bias you can state in one sentence. Fail: no clear bias, or the setup you want is against it.
2
Setup — let Bollinger Bands tell you what kind of trade it is
On the 4H chart, the bands classify the market into one of three trades:
• Squeeze breakout — the bands have contracted to a narrow width and price breaks out with a bubble candle (full guide).
• Trend pullback — in a trend with a clear bias, price pulls back to the middle band (20 SMA) and holds.
• Band fade — only in a confirmed range, price stretches to an outer band and starts to revert.
Pass: one of the three is clearly in play and agrees with the layer-1 bias. Fail: price is mid-band with no structure — there is nothing to trade yet.
• Squeeze breakout — the bands have contracted to a narrow width and price breaks out with a bubble candle (full guide).
• Trend pullback — in a trend with a clear bias, price pulls back to the middle band (20 SMA) and holds.
• Band fade — only in a confirmed range, price stretches to an outer band and starts to revert.
Pass: one of the three is clearly in play and agrees with the layer-1 bias. Fail: price is mid-band with no structure — there is nothing to trade yet.
3
Momentum — RSI for strength, MACD for acceleration
For a long: RSI at or above 50 (buyers in control) with no bearish divergence against the move, and the MACD histogram turning up or growing, ideally with the MACD line above its signal line. For a short, the mirror image. RSI tells you the move has real strength; MACD tells you it is picking up speed rather than fading.
Pass: both agree with the trade direction. Half-pass: one agrees, the other is neutral. Fail: either shows divergence or a signal against you.
Pass: both agree with the trade direction. Half-pass: one agrees, the other is neutral. Fail: either shows divergence or a signal against you.
4
Volume — the last question before you click
Compare the signal candle’s volume to its own 20-period average. For breakouts and reversal candles, a common benchmark is roughly 1.5x to 2x or more of that average; for pullback entries, you want volume to dry up on the pullback and pick up on the bounce. Thin volume does not make a trade impossible, but it moves the odds against it. (Treat these multiples as starting points and calibrate them on the markets you trade.)
Pass: volume supports the move. Fail: a breakout or reversal on light volume.
Pass: volume supports the move. Fail: a breakout or reversal on light volume.
5
Risk — the layer that decides whether you are still trading next month
Every trade needs three numbers before entry: a stop-loss from structure (below the squeeze range, the 50 SMA and pullback low, or the third dip), a position size that risks no more than about 1% of the account if that stop is hit, and a target that pays at least 2:1 (the middle band, the prior high or the measured move). If the structure-based stop is too wide for your 1% risk at a sensible size, the answer is a smaller position or no trade — never a tighter stop that sits inside the noise. See the guides on stop-losses and position sizing.
Pass: stop, size and a 2:1 target all exist and fit your rules. Fail: any of them is missing.
Pass: stop, size and a 2:1 target all exist and fit your rules. Fail: any of them is missing.
Scoring the Setup — Deciding How Big to Go
Five layers give you a simple confluence score. Count one point per layer that passes (a half-pass on momentum counts as half a point). Then let the score — not your mood — set the size.
5 / 5
Full size
Everything agrees. Risk your standard amount (for example 1% of the account).
4 / 5
Reduced size
One layer is soft or neutral. Take it at about half your normal risk, or wait for the soft layer to improve.
3 or less
Skip
Not enough agreement. There will be another setup. Skipping is a position.
💡 Two rules that are not negotiable
Layer 1 and layer 5 are gates, not points. If the trade fights the bias, or you cannot define a stop and a size, the score does not matter — you do not take it. The other three layers add conviction; these two are what keep you alive.
Where the 1-2-3 Money Scanner Fits In
Running a five-layer checklist on 200+ markets by hand is not realistic. That is the job of the 1-2-3 Money Scanner. It watches the market for the Bollinger Band sequence — squeeze, bubble, three dips, then the “Money” bounce — and surfaces the markets that have completed it. The scanner finds candidates. The checklist decides which ones deserve capital.
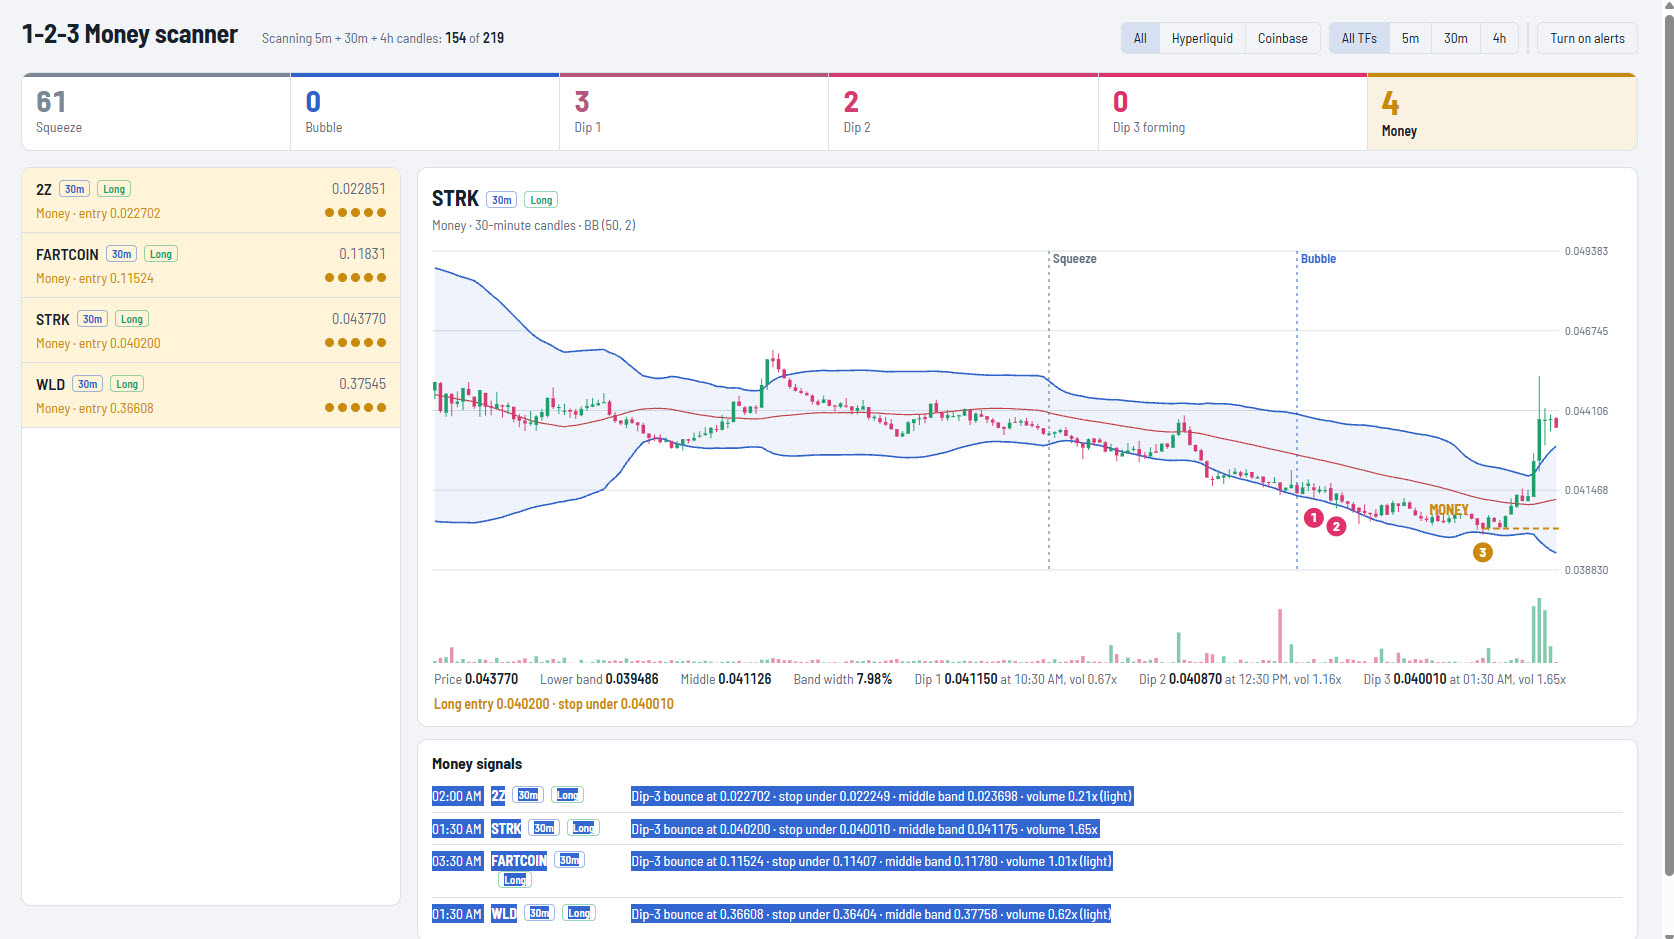
The 1-2-3 Money Scanner mid-scan: 154 of 219 markets checked, 61 in squeeze, 4 with a completed Money signal. The STRK 30m chart is expanded, showing the squeeze, the bubble, dips 1–3 and the entry.
Reading the Scan
✓
The tab counters are the funnel. Across the top, this scan shows 61 markets in a squeeze, 0 at the bubble stage, 3 on Dip 1, 2 on Dip 2, 0 forming Dip 3, and 4 at Money. That is the whole sequence at a glance: lots of markets coiling, and a handful that have progressed through to a bounce.
✓
The chart shows the structure. On the STRK 30-minute chart the dotted lines mark the squeeze and the bubble, the numbered circles mark the three dips below the lower band, and the dashed gold line marks the entry. This is layer 2 — the Bollinger Band setup — drawn for you.
✓
It already hands you layers 4 and 5. Each signal includes a stop, the middle band as a reference target, and a volume reading flagged “light” when volume is below normal. That is the volume filter and the risk numbers, ready to use.
⚠️
What it does not show. The scanner does not tell you the daily bias (layer 1) or the RSI and MACD picture (layer 3). Those you still check on the chart yourself before acting — a Money signal against the daily trend, or with RSI and MACD pointing the wrong way, is a lower-quality trade.
The Four Money Signals Through the Checklist
Here are the four signals from the screenshot, with the risk numbers worked out from the scanner’s own entry, stop and middle-band values. I can only score the layers the screenshot shows — setup, volume and risk — so the verdict below is a partial one.
Look at what separates them. On risk and reward, all four clear the 2:1 minimum, and two look very attractive on paper (WLD at 5.6:1, STRK at 5.1:1). Layer 5 alone would not tell them apart. Volume does. Only STRK’s entry candle clears the roughly 1.5x benchmark from the volume guide — and its Dip 1, Dip 2 and Dip 3 readings climbed from 0.67x to 1.16x to 1.65x as the structure built. The scanner flags the other three as light, so under this system they lose a point on layer 4 and sit in the “wait, or half size” band at best.
A fair warning about hindsight. In the screenshot, STRK has already moved well above its entry. That is one example, and a single outcome proves nothing — light-volume setups can work and high-volume ones can fail. I am showing it to illustrate the process: the volume filter kept STRK on the shortlist and pushed the other three down it, before the result was known. Judge a system by many trades, not one chart.
The Workflow — Top-Down, in About Ten Minutes
Tighter Timeframes, Same Checklist
The same layers work on faster charts — the scanner screenshot above is on the 30-minute timeframe — but the signals get noisier as the timeframe shrinks. A reasonable rule: keep the bias layer on the daily, and treat 5-minute scanner signals as a heads-up that needs the higher-timeframe layers to confirm, as covered in the scanner guide.
Where Traders Break the System
❌
Treating the scanner as an automatic buy button
A Money signal is a candidate, not a command. Skipping layers 1 and 3 turns a decent tool into a coin-flip generator. The scanner narrows the field; the checklist makes the call.
❌
Taking the trade on 3 out of 5 because “it looks good”
The checklist is only useful if it can say no. If you override a low score every time the chart looks exciting, you do not have a system — you have a set of excuses with indicators on it.
❌
Adding more indicators when a trade loses
A losing trade is not proof the system needs a sixth tool. Review whether you followed it. Most losses in a sound process are either normal variance or a rule that was skipped, not a missing indicator.
❌
Moving the stop after entry
Layer 5 is decided before the trade. Widening a stop because price is close to it is how a 1% risk becomes a 3% loss. Move a stop only in the direction of profit.
The Pre-Trade Checklist — Copy This
📋 Before every trade
☐ Bias: Is the trade direction allowed by the daily 200 SMA?
☐ Setup: Is it a squeeze breakout, trend pullback or range fade — and does it fit the bias?
☐ RSI: On the right side of 50, with no divergence against me?
☐ MACD: Histogram turning or growing in my direction?
☐ Volume: Entry candle at a healthy multiple of its 20-period average?
☐ Stop: Placed from structure, not from my comfort level?
☐ Size: Risks about 1% (or half that on a 4/5) if the stop is hit?
☐ Target: At least 2:1 to the middle band, prior high or measured move?
☐ Score: 5 = full size · 4 = reduced · 3 or less = skip. Gates (bias and risk) must both pass.
Frequently Asked Questions
The Full Series — Every Layer in Depth
1 · Bias
Moving Averages: 20, 50 and 200 SMA
2 · SetupWhat Are Bollinger Bands? Full Guide
2 · SetupThe Bollinger Band Squeeze Guide
3 · MomentumHow to Use RSI on Hyperliquid
3 · MomentumThe MACD Explained
4 · VolumeVolume Analysis on Hyperliquid
5 · RiskHow to Size a Trade
ToolThe 1-2-3 Money Scanner
The Bottom Line
A trading system is not a clever entry signal. It is a set of questions you ask in the same order every time, with answers that are specific enough to be a yes or a no. Bias says which side. The bands say what kind of trade. RSI and MACD say whether the move is real and building. Volume says whether the market meant it. Risk says how much you are willing to lose to find out.
Use the scanner to shrink 219 markets to a short list. Run each name through the five layers. Take the 5s at full size, the 4s at half, and skip everything else without guilt. You will miss some winners. In exchange you will stop taking the trades that drain an account slowly — and that is the trade-off every durable system is built on.
New to Hyperliquid? Start With the Ultimate Guide
Wallet setup, first deposit and first trade — everything from scratch before you start running the system.
| READ THE ULTIMATE GUIDE → |

📘 CryptoJag Digital Product
The Hyperliquid Blueprint
How to Connect, Trade, and Profit on the World’s Fastest DEX — the full setup, indicators and trade execution in one guide.
| GET THE BLUEPRINT → |
🎬 Video Courses
Watch. Follow along. Get it done.
Short, focused video courses — on screen, step by step.
🎁 Run the System on Hyperliquid — Get 4% Off
Sign Up via My Referral Link
Permanent 4% taker fee discount — use limit orders on your entries and you pay no taker fee at all.
🇺🇸 US Residents: Use a VPN first — I use FastVPN by Namecheap.
Use code CRYPTOJAG or click the link above
🎬 Watch the system run live on YouTube
Subscribe to CryptoJag for live walkthroughs of the scanner, the five-layer checklist and real Hyperliquid setups.
| ▶ SUBSCRIBE ON YOUTUBE |

— Chris
Founder · CryptoJag
I built the scanner because I got tired of staring at charts hoping something would jump out. But the scanner was only half of it. The thing that actually changed my results was deciding in advance what a good trade has to look like — and then being willing to say no to everything that did not. A checklist is not exciting. It feels slow, and some days it tells you to do nothing. That is the point. Write yours down, tape it next to the screen, and treat every skipped trade as a trade you did not have to lose.
This post is for educational purposes only and does not constitute financial or trading advice. The CryptoJag Trading System is a decision framework, not a guarantee of profit, and the scoring thresholds are illustrative starting points to adapt to your own testing and risk tolerance. The scanner screenshot is a single point in time and a single example; past price action does not predict future results. All trading involves risk of loss. The Hyperliquid referral link earns CryptoJag a commission at no additional cost to you.