

Introduction: Why Japanese Candlesticks Still Dominate Technical Analysis


In today’s algorithm-driven markets, traders still rely heavily on Japanese candlestick patterns for one simple reason: they reveal market psychology in real time. Every candlestick represents a battle between buyers and sellers. The body shows conviction. The wicks reveal rejection. The close signals control.
While many traders memorize patterns mechanically, professionals focus on high-probability bullish and bearish setups that align with context, trend structure, liquidity, and momentum. A hammer in isolation is meaningless. A hammer at weekly support after a liquidity sweep? That’s information.
This guide will move beyond pattern memorization and into execution—helping you understand how to identify, validate, and trade bullish candlestick patterns and bearish candlestick patterns with precision.
The Foundation: Understanding Candlestick Structure and Market Psychology

Before discussing setups, you must understand structure.
Each candlestick contains four data points:
- Open
- High
- Low
- Close
From this, we derive three critical components:
1. The Real Body
The distance between open and close. Large bodies indicate conviction and strong order flow. Small bodies indicate indecision or equilibrium.
2. Upper Wick (Shadow)
Represents price rejection above the body. Long upper wicks signal supply or distribution.
3. Lower Wick (Shadow)
Represents rejection below the body. Long lower wicks signal demand or accumulation.
In price action trading, the close is the most important element. Markets remember where candles close. A bullish candle that closes near its high demonstrates aggressive buying. A bearish candle that closes near its low shows sustained selling pressure.
Understanding this psychology transforms candlesticks from shapes into strategic information.
High-Probability Bullish Candlestick Setups


Not all bullish patterns are equal. High-probability setups share three characteristics:
- They occur at key support or demand zones
- They align with higher timeframe structure
- They show strong follow-through
Let’s examine the most reliable ones.
1. Bullish Engulfing Pattern
A bullish engulfing pattern occurs when a large bullish candle completely engulfs the prior bearish candle’s body.
Why it works:
- It signals a decisive shift in control from sellers to buyers.
- It traps short positions.
- It often marks the beginning of momentum expansion.
Best context:
- At higher timeframe support
- After a liquidity sweep below recent lows
- In a broader uptrend pullback
Avoid trading this pattern in sideways consolidation without structural confirmation.
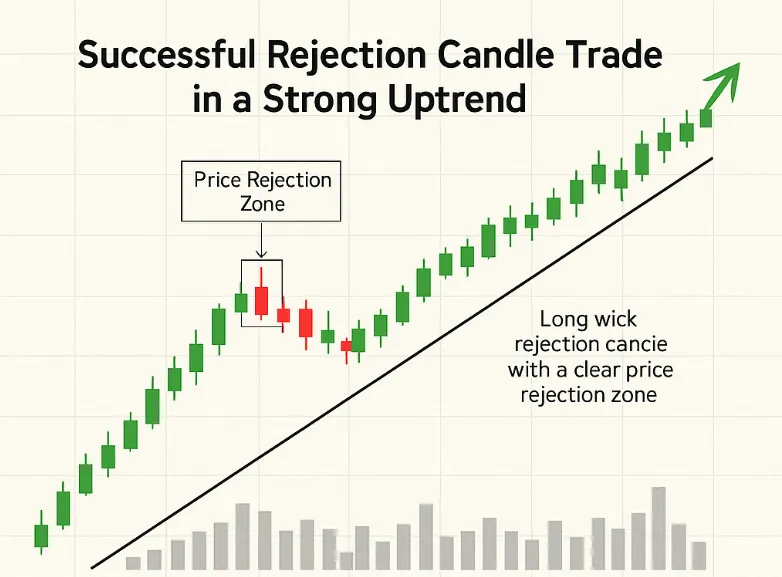
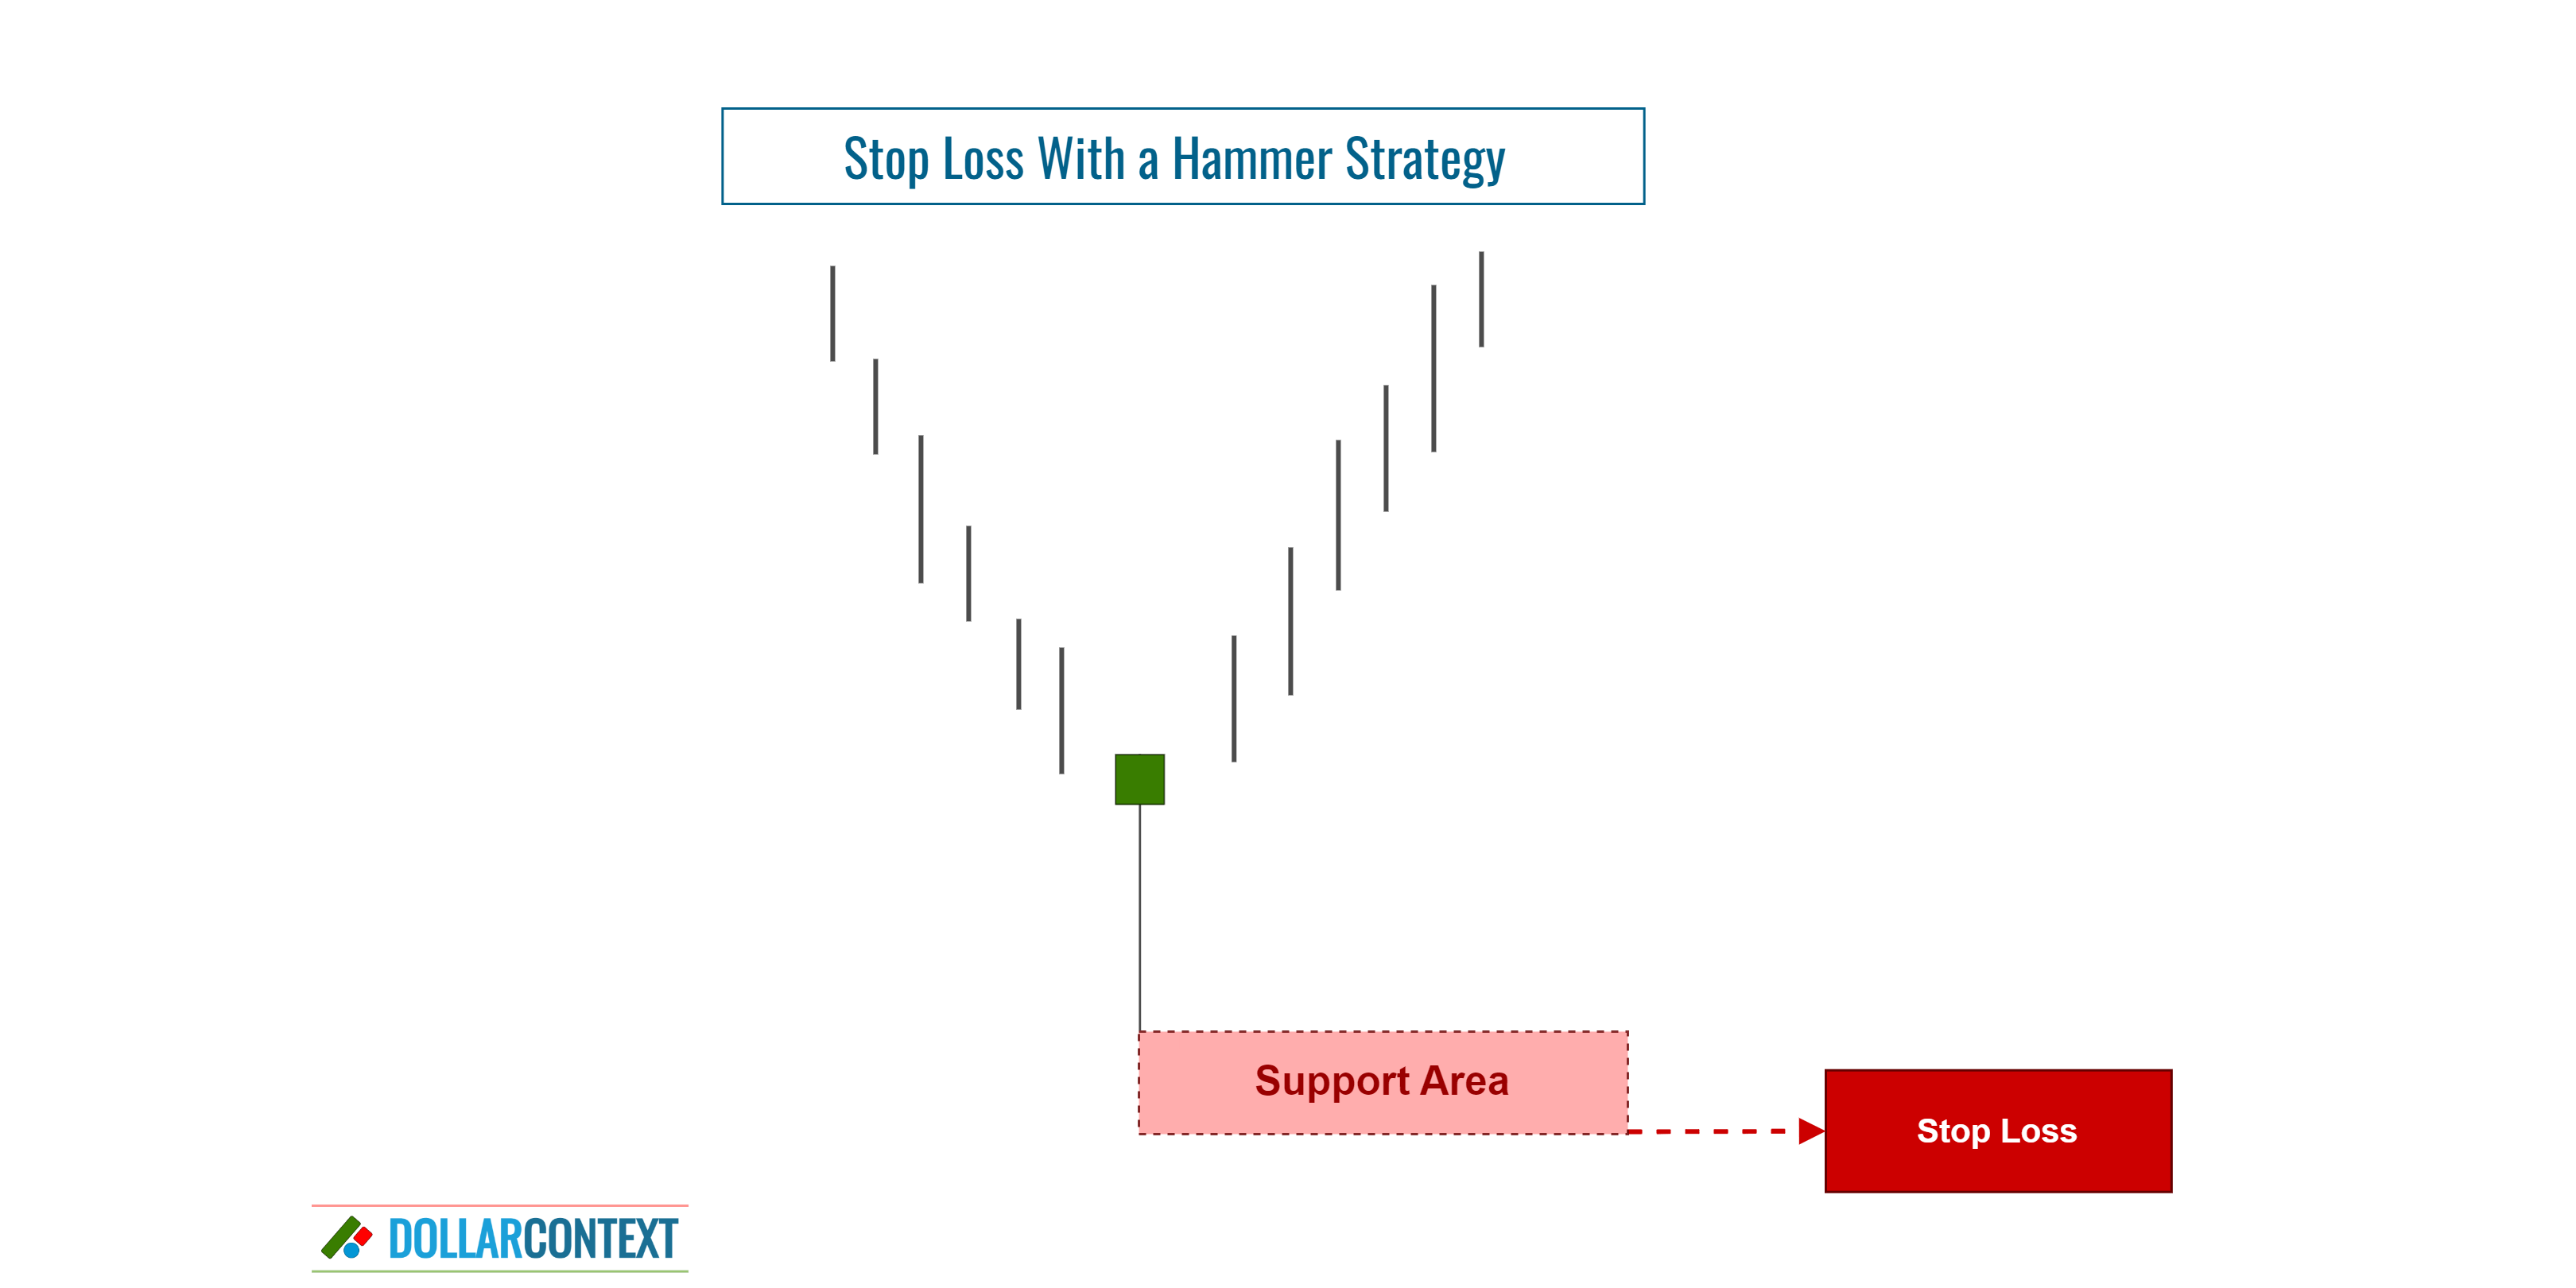
2. Hammer (Pin Bar)
A hammer candlestick pattern features:
- Small body near the top
- Long lower wick
- Little or no upper wick
It signals aggressive rejection of lower prices.
The hammer becomes high-probability when:
- It forms at established support
- Volume increases
- It follows a prolonged decline
A hammer in the middle of range-bound noise is weak. A hammer after a stop-hunt below support is powerful.
3. Morning Star Pattern
The morning star pattern is a three-candle formation:
- Strong bearish candle
- Indecision candle (small body)
- Strong bullish candle closing into the first candle’s body
This represents exhaustion → transition → reversal.
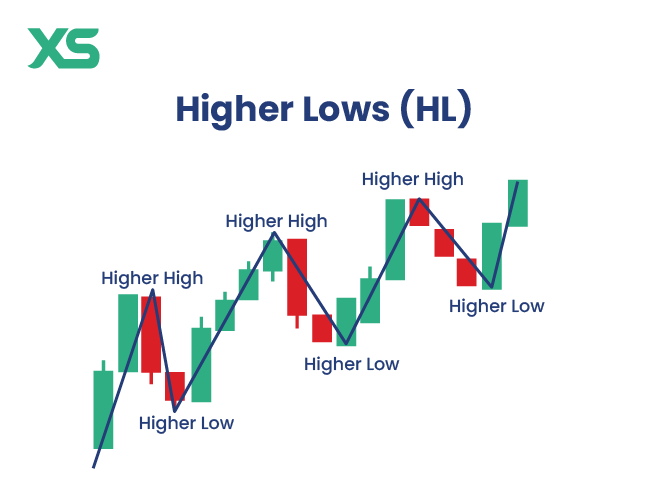
It is especially effective in swing trading environments where market structure is shifting from lower lows to higher lows.
High-Probability Bearish Candlestick Setups


Bearish setups follow the same principles as bullish ones—context first, pattern second.
1. Bearish Engulfing Pattern
A bearish engulfing pattern occurs when a strong bearish candle fully engulfs the prior bullish candle.
High-probability conditions:
- At major resistance
- After an extended rally
- Near trendline or supply zone rejection
This pattern often signals distribution and institutional selling pressure.
2. Shooting Star
The shooting star candlestick pattern has:
- Small body near the low
- Long upper wick
- Minimal lower wick
It indicates price was pushed higher and sharply rejected.
When it forms at resistance with declining momentum, it becomes a strong reversal signal.
3. Evening Star
The evening star pattern mirrors the morning star:
- Strong bullish candle
- Indecision candle
- Strong bearish candle closing into the first candle’s body
It signals trend exhaustion and the beginning of downside momentum.
Context Is Everything: Location Over Pattern


Most traders lose money because they trade patterns without context.
A key principle of technical analysis using candlesticks is this:
Location determines probability.
High-probability setups occur at:
- Support and resistance levels
- Supply and demand zones
- Trendline confluence
- Fibonacci retracement zones
- Liquidity pools
For example:
- A bullish engulfing pattern at random mid-range = low probability.
- A bullish engulfing pattern after a liquidity sweep at daily support = high probability.
Institutional traders focus on liquidity. Retail traders focus on patterns. The edge lies in combining both.
Confirmation Techniques to Increase Probability
To trade high-probability candlestick setups, add confirmation layers.
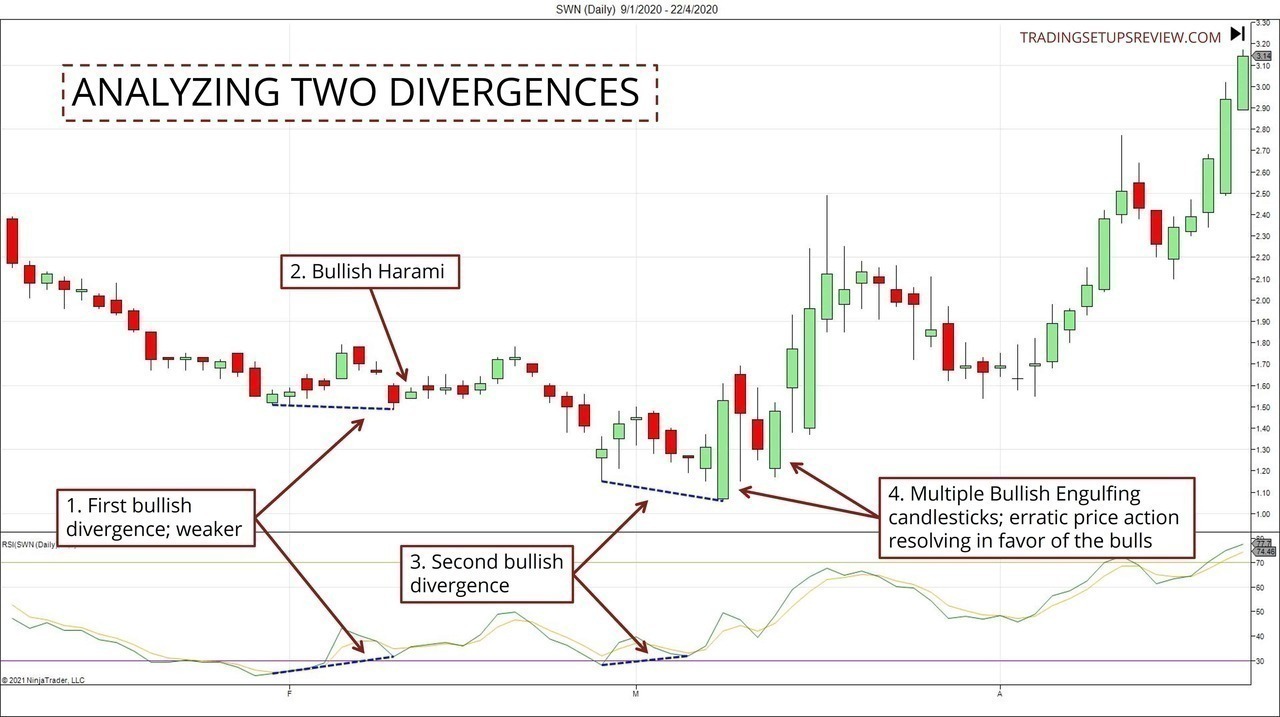
1. Momentum Divergence
If a bullish reversal pattern forms while RSI shows bullish divergence, probability increases.
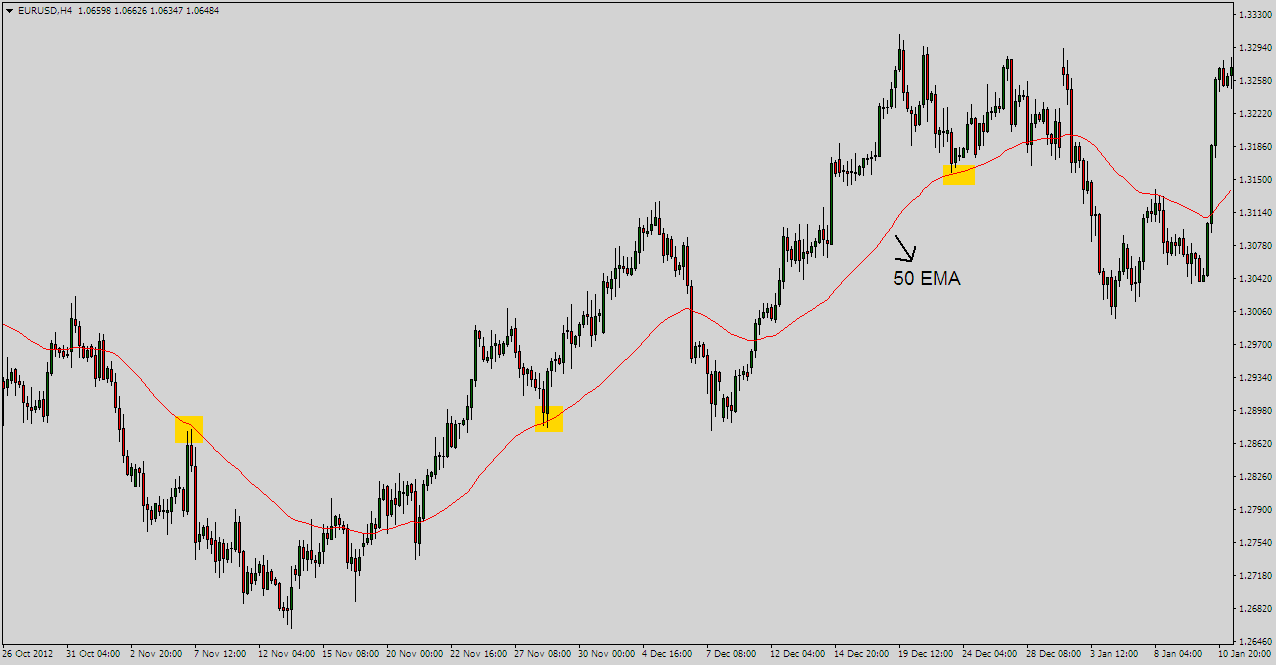
2. Moving Average Confluence
A bearish engulfing pattern rejecting the 200-day moving average is more significant than one floating in open space.
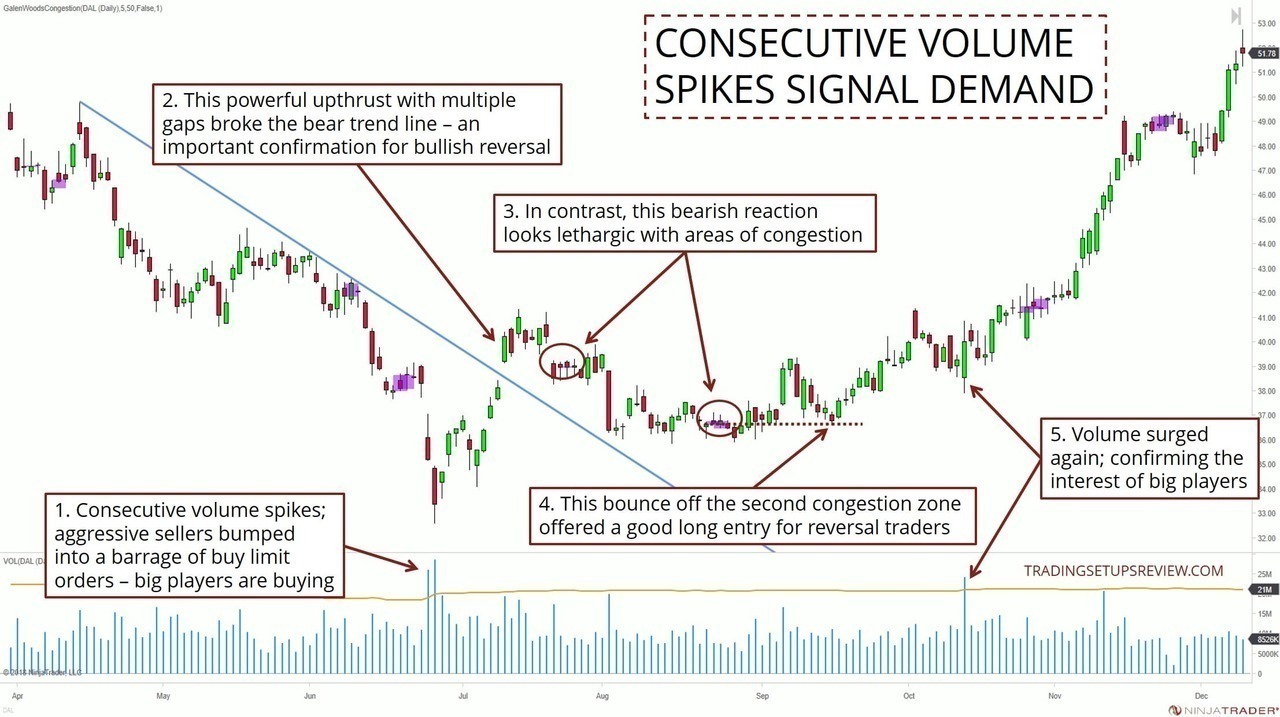
3. Volume Expansion
Reversal candles accompanied by volume spikes indicate institutional participation.
4. Multi-Timeframe Alignment
A 1-hour bullish pattern aligned with daily support is stronger than one against daily structure.
Stacking confluence transforms ordinary setups into asymmetric opportunities.
Risk Management: Where Most Traders Fail

Even the best bullish and bearish candlestick patterns fail.
Professional trading is not about prediction. It’s about risk asymmetry.
Stop Placement
- For bullish setups: below the rejection wick.
- For bearish setups: above the rejection wick.
Risk-to-Reward Ratio
Aim for minimum 1:2 or 1:3 risk-to-reward.
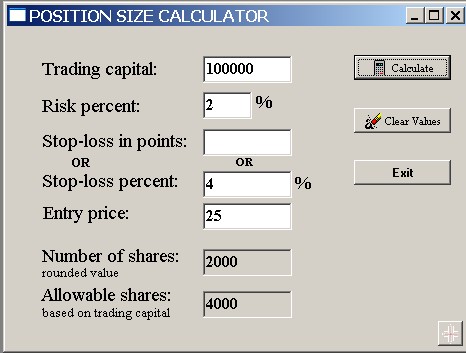
Position Sizing
Never risk more than 1–2% of capital per trade.
Trade Management
- Partial profit at first structure level.
- Trail stops as structure confirms.
Consistency comes from process, not pattern accuracy.
Common Mistakes When Trading Candlestick Patterns
- Trading every pattern mechanically
- Ignoring higher timeframe trend
- Entering before candle close
- Overleveraging
- Ignoring market regime (trend vs range)
A candlestick trading strategy must be rules-based, not emotional.
Building a Repeatable Candlestick Trading Framework
To master Japanese candlestick trading, follow this structured process:
- Identify higher timeframe bias
- Mark key support and resistance
- Wait for liquidity interaction
- Look for high-probability reversal pattern
- Confirm with confluence
- Execute with defined risk
- Journal the trade
Over time, patterns will become secondary. Structure and liquidity will become primary.
Final Thoughts: From Pattern Recognition to Market Understanding
Japanese candlestick patterns are not magic signals. They are visual representations of order flow and crowd psychology.
High-probability setups occur when:
- Structure aligns
- Liquidity is swept
- Momentum shifts
- Volume confirms
- Risk is defined
Mastery comes from patience and repetition. The goal is not to trade more patterns. The goal is to trade fewer, better setups with precision.
If you internalize this approach, you move from reactive trader to strategic operator—using bullish and bearish candlestick setups as tools within a broader framework of disciplined execution.