The NYSE market open at 9:30 AM EST is one of the most important liquidity events of the day for financial markets. While Bitcoin trades 24/7, it still reacts strongly to the surge of institutional activity when U.S. equities begin trading. This influx of capital often creates sudden volatility that crypto traders can exploit using simple and reliable price-action patterns.
Two of the most powerful patterns that frequently appear during this window are the hammer candle and the bullish engulfing candle. When these patterns form shortly after the first 15 minutes of trading, they can signal a sharp reversal or continuation that traders can use for quick scalps or short-term intraday trades.
In this guide, you’ll learn how to identify and trade hammer candles, how to use bullish engulfing candles for confirmation, and how to build a repeatable strategy around the Bitcoin NY open trading session.
Why the NY Market Open Matters for Bitcoin Traders


Although Bitcoin operates outside traditional market hours, large institutional participants still operate during standard financial trading sessions. When the U.S. stock market opens, several factors contribute to heightened volatility in crypto markets:
- Institutional trading desks begin active trading
- Macro news releases influence risk assets
- ETF flows affect Bitcoin liquidity
- Algorithmic trading systems rebalance positions
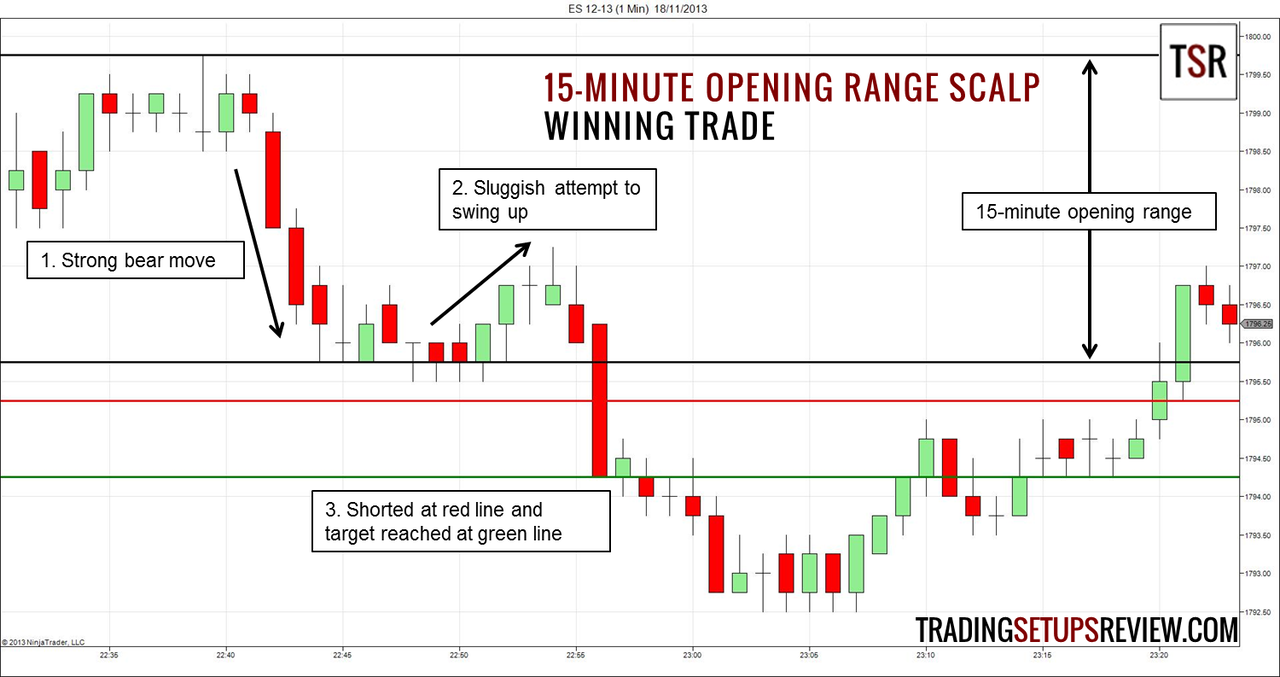
Because of this surge in activity, many traders focus on the first 15 minutes after the open, allowing the market to establish an initial range before taking trades.
This period between 9:45 AM and 10:15 AM EST often produces the most reliable setups using hammer candles and bullish engulfing patterns.
Understanding the Opening Range Strategy

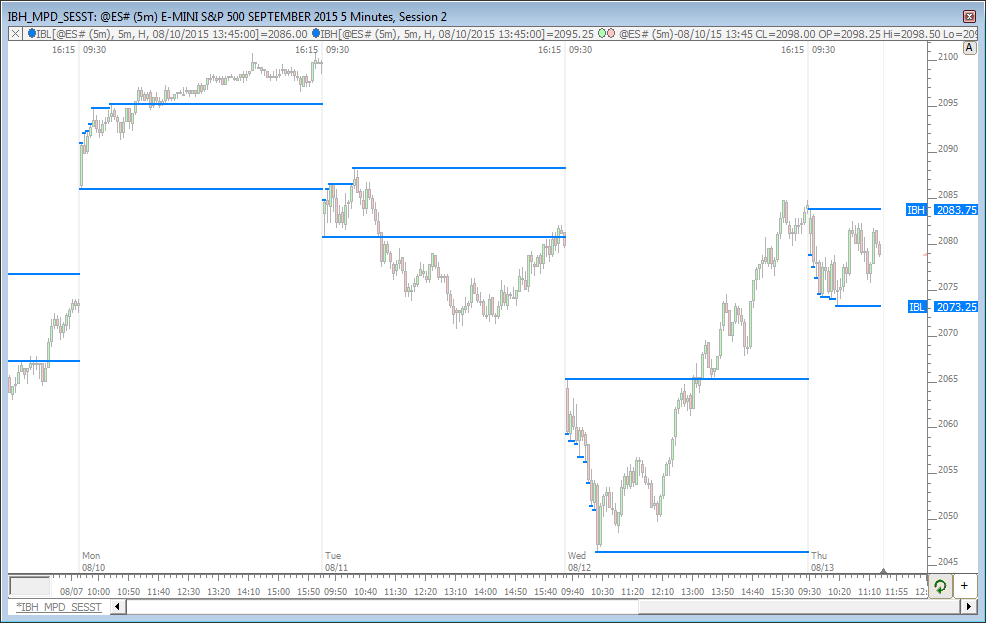
Before looking for candlestick patterns, traders typically define what is known as the opening range.
The opening range represents the high and low of the first 15 minutes of trading.
This creates two critical levels:
- Opening Range High
- Opening Range Low
These levels act as short-term support and resistance zones. Many institutional traders monitor these areas because they represent where liquidity accumulates during the early part of the session.
Once the opening range is established, traders watch how Bitcoin reacts near these levels. If price sweeps one side of the range and then forms a reversal pattern such as a hammer candle or bullish engulfing candle, it can signal a high-probability trade.
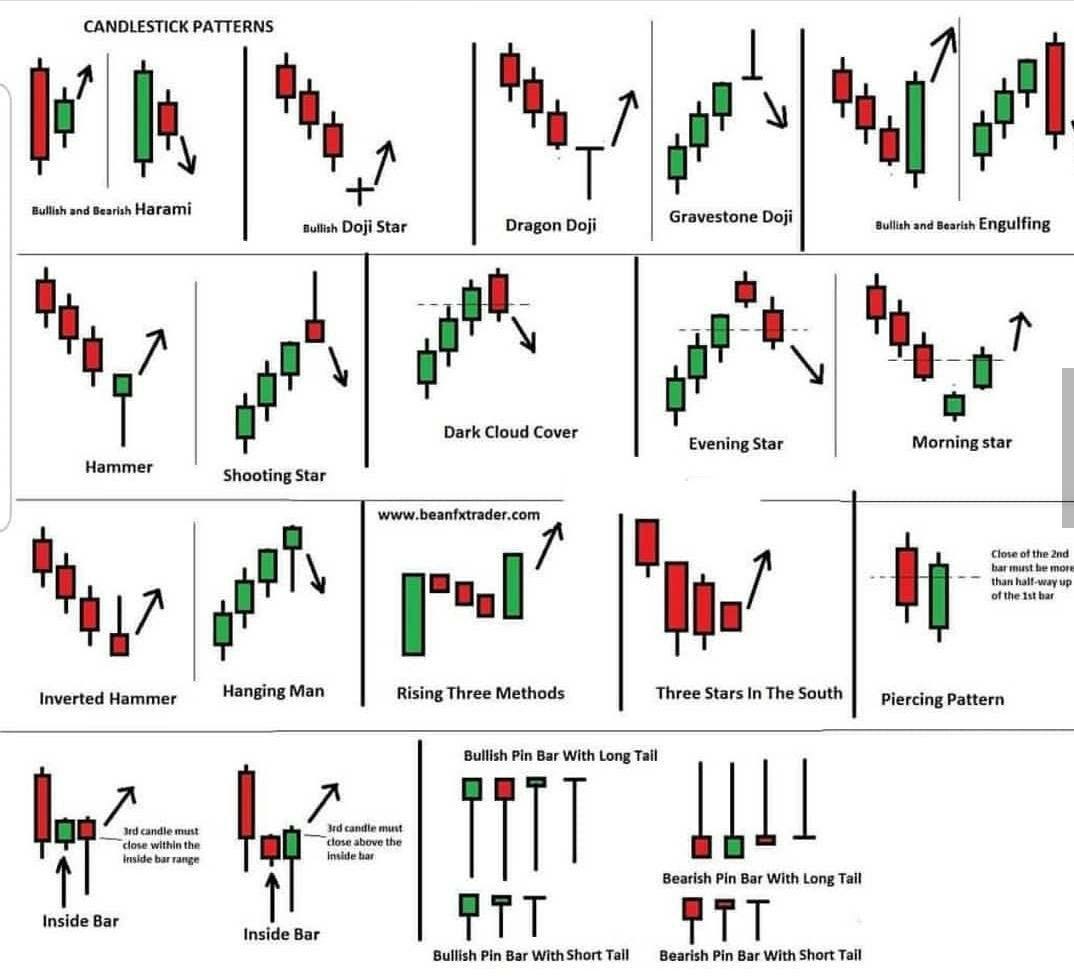
What Is a Hammer Candle?


A hammer candle is a candlestick pattern that often signals a potential bullish reversal. It forms when sellers push the price lower but buyers step in and drive the price back up before the candle closes.
Key characteristics of a hammer candle include:
- A small real body near the top of the candle
- A long lower wick
- Little or no upper wick
- Appears after a downward move
This structure indicates that selling pressure was absorbed by buyers.
When a hammer candle forms near an important support level—such as the opening range low, VWAP, or a previous demand zone—it can signal that the market is preparing to reverse upward.
However, the pattern alone is not enough. Traders often wait for confirmation before entering a trade.
What Is a Bullish Engulfing Candle?


A bullish engulfing candle is another powerful reversal signal in price action trading.
This pattern occurs when a strong bullish candle completely engulfs the body of the previous bearish candle.
Key characteristics of a bullish engulfing candle include:
- A large bullish candle
- The candle body fully covers the previous candle
- Appears after a downward price movement
- Often accompanied by increasing volume
This pattern indicates that buyers have overwhelmed sellers and momentum is shifting in favor of the bulls.
During the Bitcoin NY open trading window, a bullish engulfing candle can signal that a liquidity sweep has occurred and the market is preparing to move in the opposite direction.
Combining Hammer and Engulfing Patterns After the NY Open

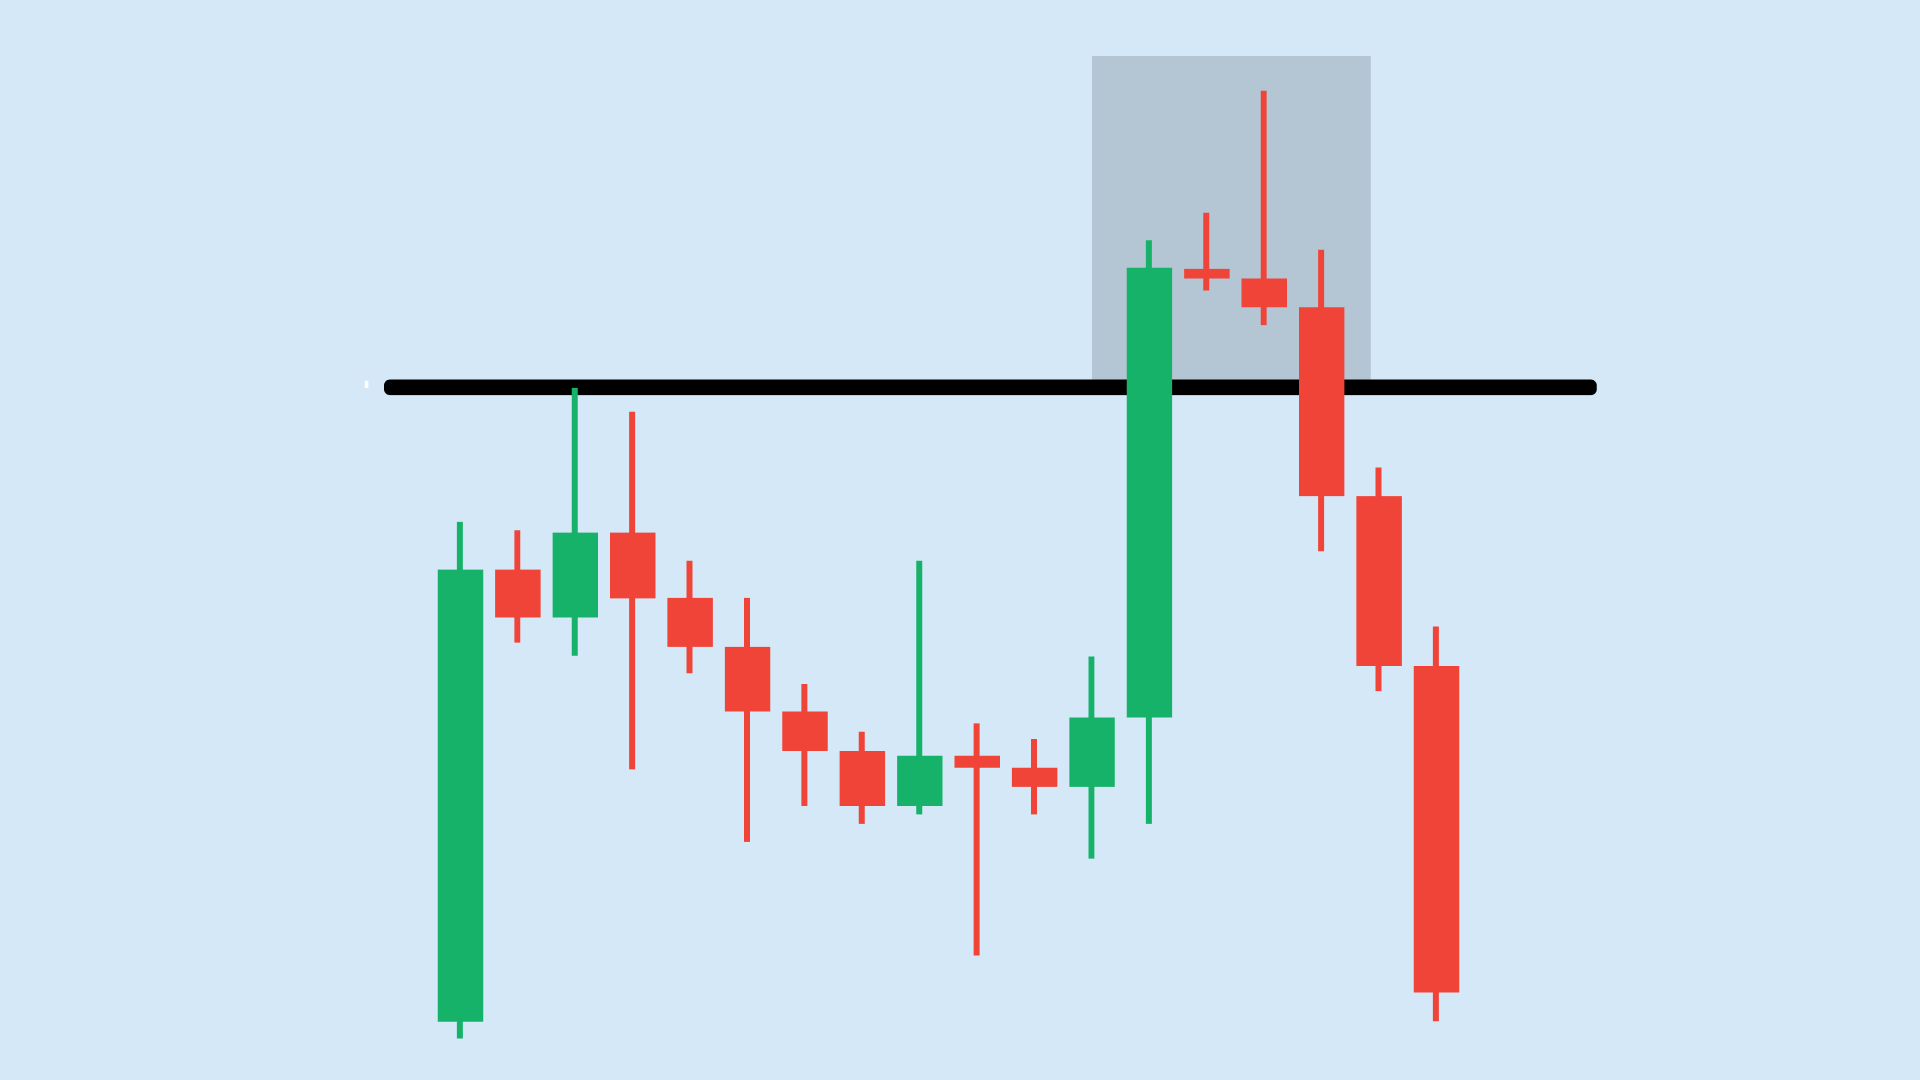
The most powerful setups occur when both patterns appear together.
For example:
- Bitcoin drops below the opening range low
- A hammer candle forms showing buyers absorbing selling pressure
- The next candle forms a bullish engulfing pattern
This combination indicates that the market likely swept stop losses below support before reversing.
This phenomenon is often referred to as a liquidity sweep or stop hunt.
Large traders push price below obvious support levels to trigger stop orders before reversing the market in the opposite direction.
When this happens during the NY open volatility window, the resulting move can be fast and substantial.
Step-by-Step Trade Setup

Here is a simple framework traders can use to execute this strategy.
Step 1: Wait for the First 15 Minutes
Do not trade immediately when the market opens.
Allow the first 15 minutes to establish the opening range.
Mark the high and low of this period on your chart.
Step 2: Watch for a Liquidity Sweep
After 9:45 AM EST, observe how price reacts near the opening range levels.
A common setup occurs when Bitcoin briefly breaks below the opening range low.
Step 3: Look for a Hammer Candle
If a hammer candle forms at the sweep level, it suggests that buyers are defending that price zone.
This is the first signal of a possible reversal.
Step 4: Wait for Confirmation
Confirmation often appears as a bullish engulfing candle immediately after the hammer.
This signals that buying momentum is entering the market.
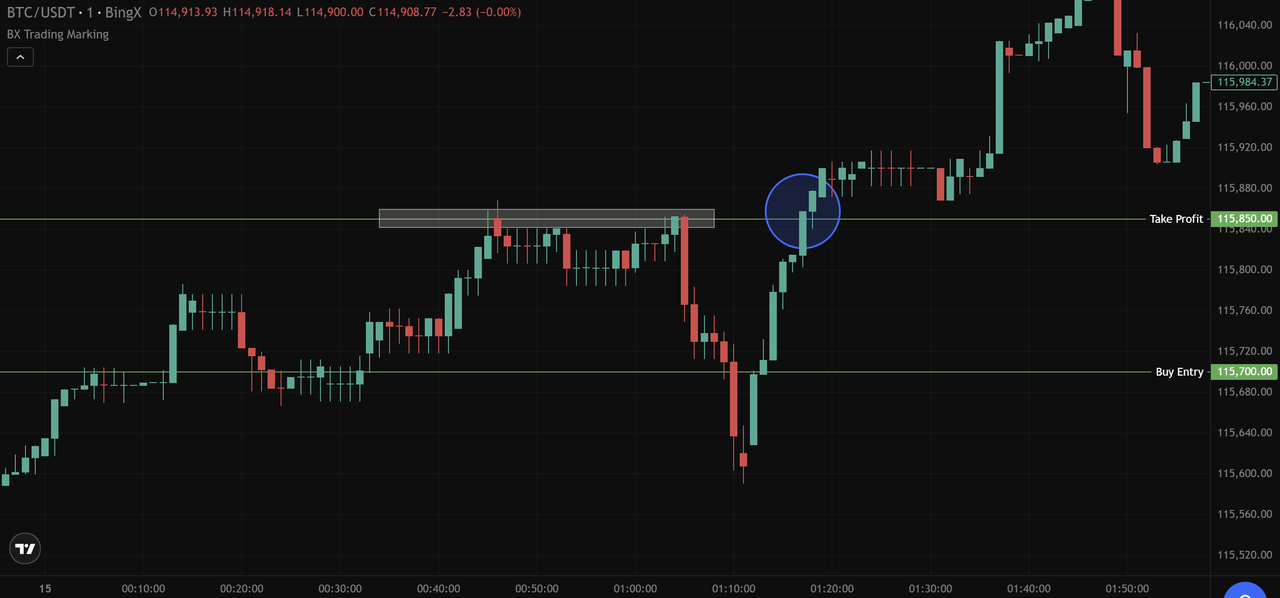
Step 5: Enter the Trade
Many traders enter once price breaks above the high of the engulfing candle.
This confirms that buyers are gaining control.
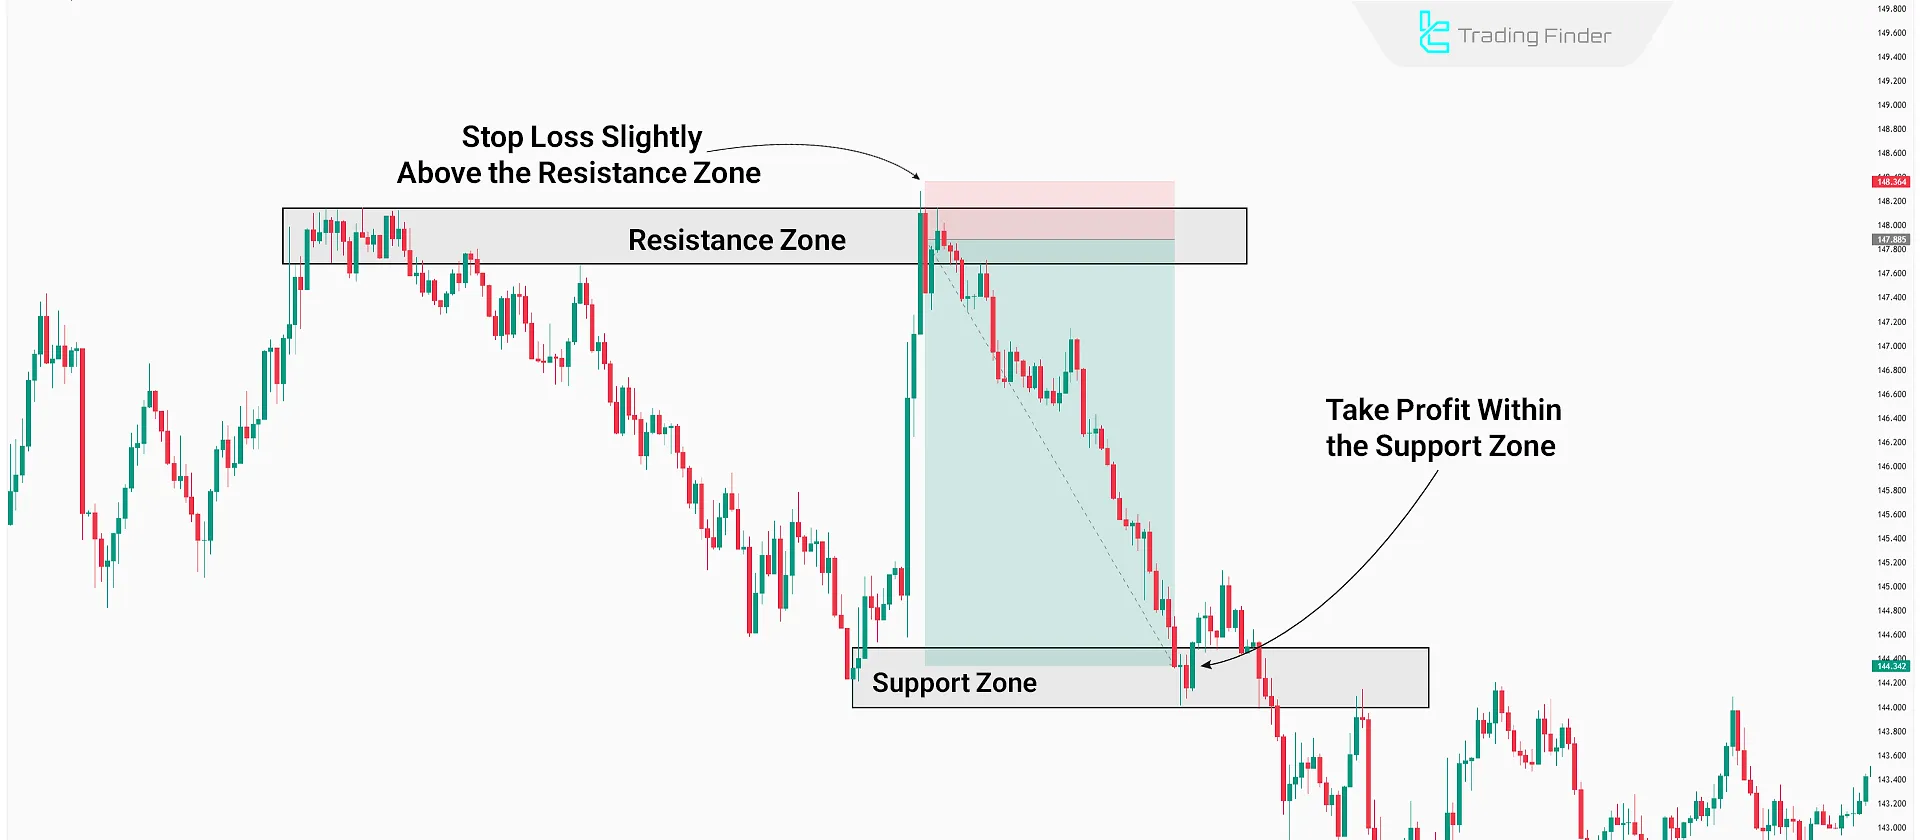
Step 6: Set Stop Loss
Place the stop loss below the low of the hammer candle.
This protects against false reversals.
Step 7: Set Profit Targets
Common profit targets include:
- The midpoint of the opening range
- The opening range high
- Nearby resistance levels
Example Bitcoin Trade Scenario


Imagine the following scenario during the NY open:
Opening range levels:
- High: $68,500
- Low: $68,000
At 9:50 AM, Bitcoin drops below $68,000 and reaches $67,850.
A hammer candle forms at this level with a long lower wick.
The next candle forms a bullish engulfing pattern that closes above $68,050.
A trader could enter above the engulfing candle at $68,100.
Stop loss could be placed below the hammer candle low at $67,800.
Potential profit targets might include:
- $68,300 (midpoint of range)
- $68,500 (range high)
This setup offers a favorable risk-to-reward ratio while following clear price-action signals.
Risk Management for Intraday Crypto Trades
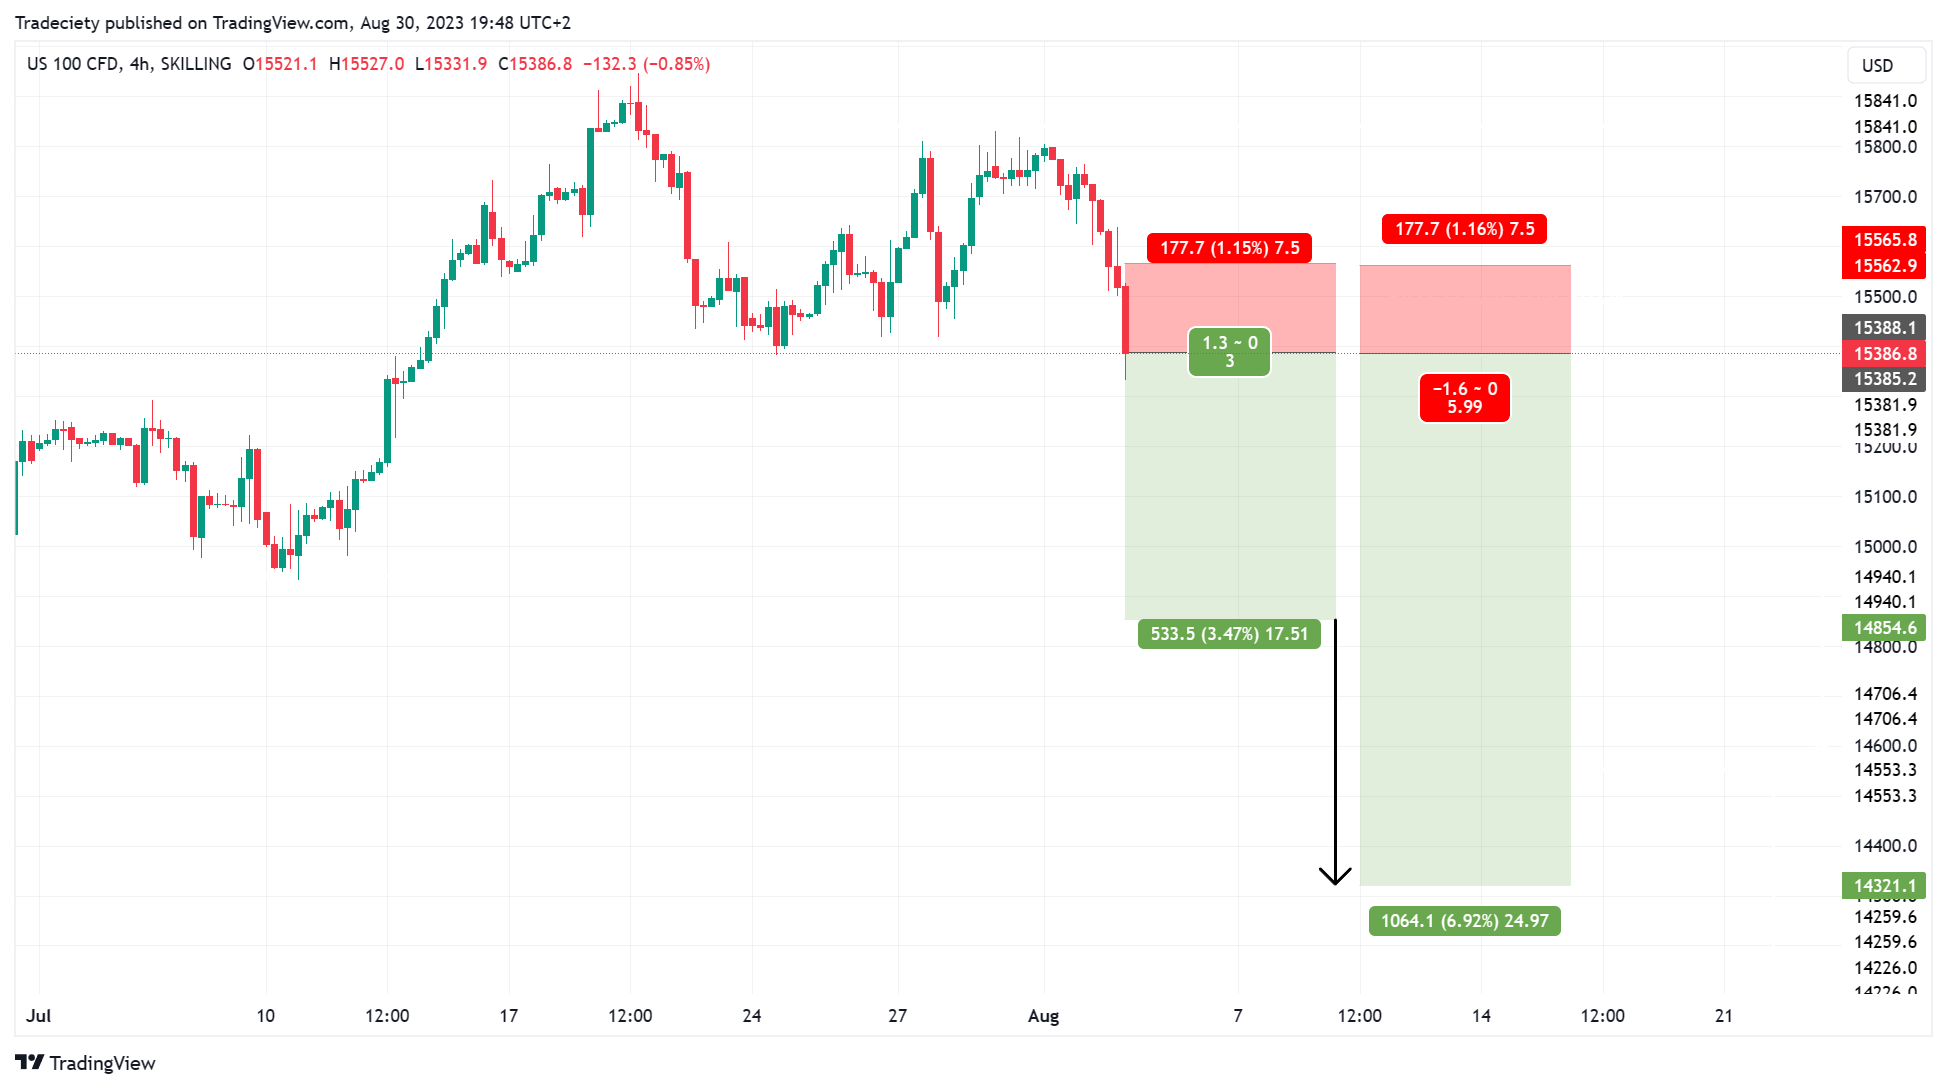

Even strong patterns like hammer candles and bullish engulfing candles can fail. That is why risk management is critical.
Professional traders follow several key principles:
- Risk only a small percentage of capital per trade
- Use clear stop-loss levels
- Avoid overtrading during volatile periods
- Maintain a minimum risk-to-reward ratio of 1:2
By following these rules, traders can remain profitable even if some trades fail.
Additional Confirmation Indicators

While price action alone can be effective, many traders combine candlestick patterns with additional indicators.
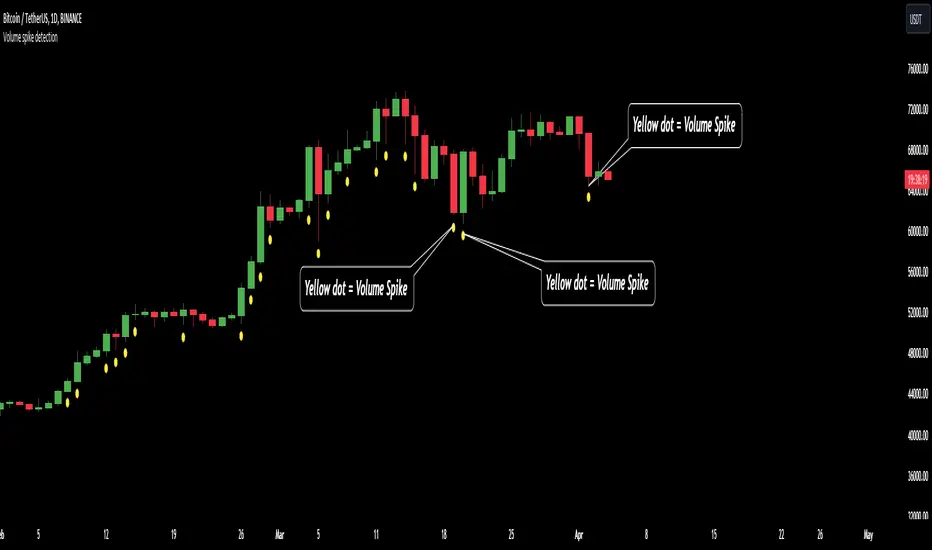
Popular confirmation tools include:
- VWAP (Volume Weighted Average Price)
- Moving averages such as the 9 EMA or 20 EMA
- Volume spikes during reversal candles
When a hammer candle or bullish engulfing candle appears near VWAP or a major support level, the probability of success often increases.
Common Mistakes Traders Should Avoid


New traders often misuse candlestick patterns.
Some of the most common mistakes include:
>Trading patterns without context
>Entering trades before confirmation
>Ignoring support and resistance levels
>Risking too much capital on a single trade
Remember that candlestick patterns work best when combined with market structure and liquidity analysis.
Final Thoughts
Trading Bitcoin around the NY market open offers unique opportunities due to the surge in liquidity and volatility. By waiting for the first 15 minutes of trading and watching for hammer candles or bullish engulfing candles, traders can identify high-probability reversal setups.
The key is patience and discipline. Allow the market to establish its opening range, wait for a liquidity sweep, and then watch for clear price-action signals.
When used correctly, the combination of hammer candles, bullish engulfing candles, and opening range analysis can become a powerful addition to any crypto trader’s toolkit.