⚠️ Not financial advice. This post documents a personal trading tool and strategy. 5-minute signals lost money after fees in backtesting — the scanner itself notes this. Always check the chart, set your stop, and size correctly. Nothing here is a signal to trade.
The problem with most technical setups is you have to find them manually — scrolling through charts one by one, hoping to spot the pattern before it fires. The 1-2-3 Money Scanner flips that around. It watches 219 crypto markets across the 5-minute, 30-minute, and 4-hour timeframes simultaneously, tracking each market’s position in a specific Bollinger Band signal sequence and alerting you when the pattern completes.
The strategy behind it is built on a 1-2-3 pattern: a Bollinger Band squeeze fires a bubble (price breaks outside the bands), the bubble pulls back through two dip phases, and the third dip is the entry signal — the “Money” alert. Here’s how the whole thing works and how I use it on Hyperliquid.
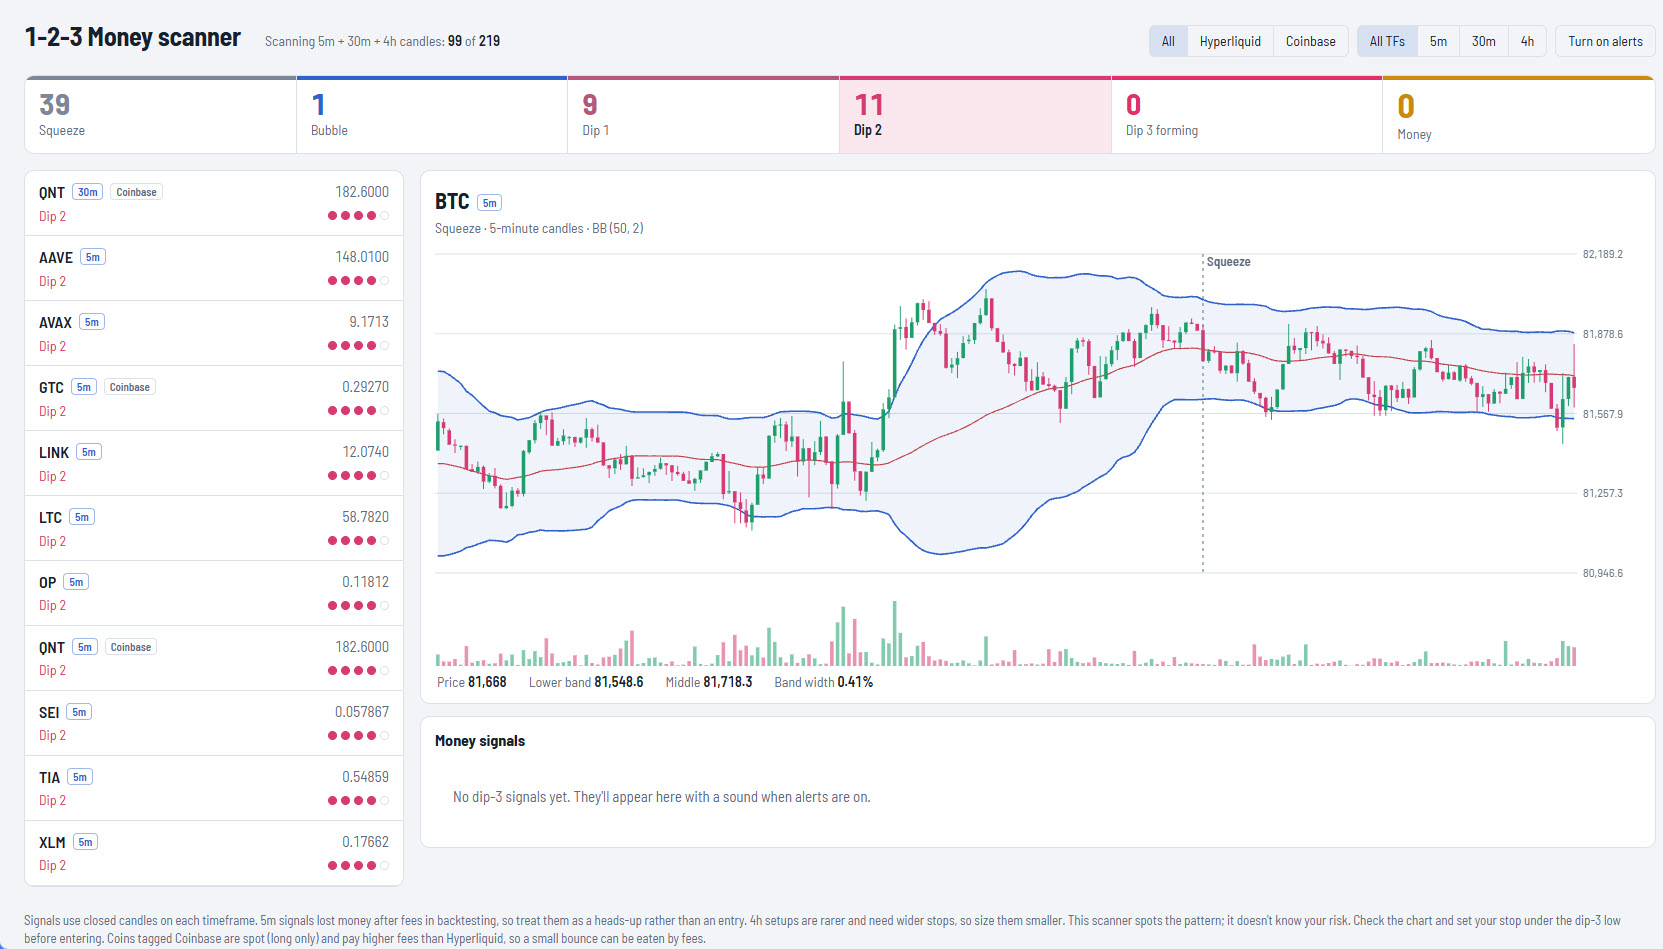
The 1-2-3 Money Scanner — BTC 5m showing a squeeze with band width at 0.41%. 39 squeezes, 11 Dip 2 signals, and 0 Money signals active across 219 markets.
Reading the Scanner — What Each Tab Means
The scanner header shows six signal categories with live counts. In the screenshot above you can see: Squeeze (39), Bubble (1), Dip 1 (9), Dip 2 (11), Dip 3 Forming (0), Money (0). Each is a stage in the sequence.
SQUEEZE
39 markets
39 markets
The Bollinger Bands have contracted to a historically narrow range. This is the setup phase — the market is coiling. No entry yet. You’re watching. The screenshot shows BTC on the 5m with band width at just 0.41% — extremely compressed. 39 markets are in squeeze simultaneously, which is a meaningful cluster.
BUBBLE
1 market
1 market
The squeeze has fired. Price has broken outside the Bollinger Bands — either above the upper band (bullish bubble) or below the lower band (bearish bubble). The energy that was coiling in the squeeze has now been released. This is the breakout candle. Still not the entry — the bubble is the trigger that sets up the dip sequence.
DIP 1
9 markets
9 markets
Price has pulled back from the bubble for the first time. After a bubble fires, markets rarely continue in one direction without pausing — this pullback is the first dip. The market is digesting the move. Still watching, not entering. Wait for the second dip.
DIP 2
11 markets
11 markets
The second pullback. The market bounced from Dip 1 and has now pulled back again. At this stage — with 11 markets currently showing Dip 2 — you start paying close attention. You’re one step from the entry signal. Open the chart, check the structure, identify where Dip 3 would likely form and where you’d set your stop.
DIP 3
0 forming
0 forming
Dip 3 forming means the third pullback is in progress. This is the pre-alert phase. The scanner is about to fire a Money signal. If you have alerts on, this is when the sound goes off on your device. Turn on alerts in the scanner for Dip 3 — you want to know the moment this fires so you can check the chart before the candle closes.
MONEY
0 active
0 active
The full sequence has completed. Squeeze → Bubble → Dip 1 → Dip 2 → Dip 3 has all fired on a closed candle. The scanner is saying: this market has just completed the 1-2-3 pattern. Open the chart immediately. Check the structure. If everything looks right — the stop has a logical place, the R:R is acceptable — this is the entry window.
The Critical Distinction — 5m Scalping vs 4H Swing
The scanner itself is honest about this in the disclaimer at the bottom of the screen: “5m signals lost money after fees in backtesting, so treat them as a heads-up rather than an entry. 4h setups are rarer and need wider stops, so size them smaller.”
This is important. The 5m and 4h signals are very different tools and should be used differently.
⚠️ 5m Signals — Heads-Up Only
Fast but noisy. Lost money after fees in backtesting at the signal alone. Use them as a directional heads-up — they tell you a market is active and worth watching. Require manual chart confirmation before entering. Tighter stops needed. Fees eat into small moves. If trading on Hyperliquid, use limit orders to reduce fee drag on 5m scalps.
✅ 4H Signals — Higher Quality
Rarer but more reliable. The 4h squeeze has more time-compressed energy behind it. Wider stops required — size smaller to compensate. These are swing trade setups rather than scalps. Fees are proportionally smaller relative to the move. 4h Money signals are the premium alerts from this scanner.
💡 How to use both timeframes together
The best approach: use the 4H signal as the setup and the 5m signal as the timing trigger. If a market is showing a 4H Money signal and the 5m is also showing a Dip 3, you have multi-timeframe alignment — the higher timeframe tells you the direction, the lower timeframe gives you the precise entry timing. This combination filters out most of the 5m noise while still giving you a clean entry price.
Reading the Chart Panel — What the BTC Screenshot Shows
When you click any market in the scanner, the right panel shows the live chart with Bollinger Bands (50, 2) overlaid and the current scanner status. The BTC 5m chart in the screenshot is a textbook example of what a squeeze looks like in real time.
✓
Band width: 0.41%. This is extremely compressed. The upper band, middle band (50 SMA in red), and lower band are all tightly clustered. At 0.41% band width, BTC’s 5m chart has almost no volatility — the bands are as tight as they’ve been in the recent period shown. This is the coiling phase before a move.
✓
The dotted vertical line marks the squeeze trigger point. Everything to the right of that line is post-squeeze consolidation — price is grinding sideways between the bands. The scanner correctly identifies this as an active squeeze awaiting a bubble breakout.
✓
Price vs bands: Price at $81,668, Lower band at $81,548.6, Middle at $81,718.3. Price is sitting just below the middle band — neither bullish nor bearish yet. The next significant candle with direction and volume will tell you which way this breaks.
✓
Volume (bottom panel): Volume bars have been contracting through the squeeze period — exactly what you want to see. When the bubble fires, watch for the volume bars to expand sharply. A breakout on thin volume is suspect; a breakout with volume 2–3x the recent average is genuine.
The Market List — What the Left Panel Shows
The screenshot shows the Dip 2 tab active, with 11 markets listed: QNT (30m), AAVE, AVAX, GTC, LINK, LTC, OP, QNT, SEI, TIA, XLM — all on the 5m timeframe showing Dip 2 signals. Each row shows the market ticker, timeframe badge, price, and a red dot rating (more dots = stronger signal).
Executing the Trade on Hyperliquid — Step by Step
When the Money signal fires, here is the exact process for taking the trade on Hyperliquid.
1
Open the chart immediately
When the Money alert fires, open the market’s chart on Hyperliquid (or in TradingView). Add Bollinger Bands (50, 2) if not already there. Confirm visually that the squeeze → bubble → three dips are clearly visible and the Dip 3 candle has formed cleanly — not as a wick pierce that immediately reversed.
2
Identify the stop-loss level before the entry
For a bullish pattern (bubble above upper band, dips pulling back): stop goes below the low of Dip 3, with a small buffer. The scanner’s own note says to “set your stop under the dip-3 low before entering.” If the Dip 3 low doesn’t give you acceptable R:R, skip the trade. See the stop-loss guide for exact placement steps.
3
Size the position using the 1–2% rule
Risk no more than 1–2% of your account on any single scanner signal. On 5m scalps, the moves are small and the fee drag is real — keeping position size disciplined means a string of stop-outs doesn’t compound into a serious loss. On 4h signals, the same 1–2% rule applies but the stop is wider, so the position size will be smaller. See the position sizing guide.
4
Enter with a limit order — collect the rebate
On Hyperliquid, use a limit order at or slightly above the current price rather than a market order. This earns you the 0.010% maker rebate instead of paying the 0.045% taker fee. On small scalp moves, this fee difference matters. If the entry is urgent and the candle is moving fast, a market order is acceptable — but limit order first where possible.
5
Target: middle band or upper band, trail from there
For a 5m scalp, the initial target is the middle band (50 SMA). Take at least partial profit there. If the move continues, trail the stop behind each new high (for longs). On 4h signals, the initial target can be the opposite band, with a trail beyond that. The 1-2-3 pattern is a momentum entry — if the move has real legs, it will run significantly past the first target.
Why Hyperliquid Is the Right Platform for This Strategy
✅ 230+ markets
The scanner covers 219 markets. Nearly all of them are tradeable as perps on Hyperliquid — long or short, both directions. When a Money signal fires on a Coinbase spot-only market, you can still take the perp trade on Hyperliquid without the restriction.
✅ 0.045% taker / +0.010% maker
The scanner notes fees eating into 5m scalps. On Hyperliquid with limit order entries you collect a rebate rather than paying a fee, which specifically addresses the fee drag problem the scanner identifies.
✅ Sub-second execution
Scalping requires fast fills. Hyperliquid’s own L1 blockchain executes orders in under a second — critical when you’re acting on a 5m candle close where every second counts.
✅ Short both directions
Bearish Money signals (bubble below lower band) are as valid as bullish ones. On Hyperliquid you take the short perp just as easily as the long — same interface, same fee structure.
Frequently Asked Questions
Related Guides
📊 Foundation
The Bollinger Band Squeeze Guide
🛡 RiskHow to Set a Stop-Loss on Hyperliquid
📐 SizingHow to Size a Trade (Position Sizing)
💸 FeesMarket Orders vs Limit Orders
🛠 ToolsBest Hyperliquid Tools for Traders
🏆 ResearchHow to Read the Leaderboard
The Bottom Line
The 1-2-3 Money Scanner does the scanning work that would take hours to do manually — watching 219 markets across three timeframes for the squeeze → bubble → dip 1 → dip 2 → dip 3 sequence and alerting you the moment the pattern completes. The tool is only as good as the trader using it, though. The signal is the starting point, not the trade itself. You still need to open the chart, confirm the structure, identify the stop, and check the R:R before entering.
On the 5m timeframe it’s a scalping heads-up that requires tight discipline and limit order entries to manage fees. On the 4h timeframe the signals are rarer but carry significantly more weight. Either way, Hyperliquid’s fee structure and execution speed make it the right platform to execute these trades when the scanner calls them.
New to Hyperliquid? Start With the Ultimate Guide
Wallet setup, first deposit, and first trade — everything from scratch before you start trading scanner signals.
| READ THE ULTIMATE GUIDE → |

📘 CryptoJag Digital Product
The Hyperliquid Blueprint
How to Connect, Trade, and Profit on the World’s Fastest DEX — including strategy, tools, and trade management.
| GET THE BLUEPRINT → |
🎬 Video Courses
Watch. Follow along. Get it done.
Short, focused video courses — on screen, step by step.
🎁 Trade the Money Signal — Get 4% Off
Sign Up via My Referral Link
Permanent 4% taker fee discount — stack with limit order entries and fee drag on 5m scalps drops close to zero.
🇺🇸 US Residents: Use a VPN first — I use FastVPN by Namecheap.
Use code CRYPTOJAG or click the link above
🎬 Watch 1-2-3 Money Scanner trades live on YouTube
Subscribe to CryptoJag for live walkthroughs showing exactly how I use this scanner to find and execute trades on Hyperliquid.
| ▶ SUBSCRIBE ON YOUTUBE |

— Chris
Founder · CryptoJag
I built the 1-2-3 Money Scanner because I got tired of missing squeezes on markets I wasn’t watching. The scanner doesn’t make trading decisions for me — it makes sure I don’t miss the setup in the first place. The 5-minute signals are best used as a heads-up that something is worth looking at, not as a direct entry signal. When I see a cluster of 30+ squeezes with several Dip 2 setups forming at the same time — like the screenshot above — that tells me the market as a whole is coiling and something significant is likely developing. That context, combined with individual chart review, is where the real edge is.
This post is for educational purposes only and does not constitute financial or trading advice. The 1-2-3 Money Scanner is a personal trading tool shared for educational purposes. The scanner’s own disclaimer notes that 5m signals lost money after fees in backtesting — treat them as directional heads-ups and always confirm manually. Trading leveraged perpetual contracts involves significant risk of loss. The Hyperliquid referral link earns CryptoJag a commission at no additional cost to you.