If you’ve spent any time looking at trading charts, you’ve almost certainly seen Bollinger Bands without knowing it — the three curved lines that wrap around price like an envelope, widening when the market is volatile and contracting when it goes quiet. They’re one of the most widely used indicators in trading, and for good reason: they give you a direct visual read on volatility, potential breakout conditions, and where price might be extended relative to its recent average.
Hyperliquid’s built-in TradingView chart has Bollinger Bands available as a standard indicator — two taps to add, no setup required. This guide starts from the beginning: what Bollinger Bands are, how each of the three lines is calculated, how to read every situation they describe, and the three main strategies traders use with them on crypto perps.
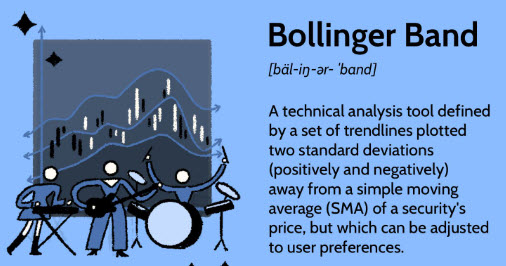
Bollinger Bands — defined. The indicator wraps trendlines two standard deviations above and below a moving average, creating a dynamic volatility envelope around price.
The Three Lines — What Each One Is and What It Measures
Bollinger Bands were developed by trader and financial analyst John Bollinger in the 1980s. The standard settings are a 20-period simple moving average with bands plotted at 2 standard deviations above and below. Here’s what each component actually measures.
MID
SMA
SMA
Middle Band — the 20-period Simple Moving Average
The foundation of the indicator. It calculates the average closing price of the last 20 candles and plots it as a smooth line through the middle of price action. This is the baseline — where price tends to return to after periods of extension in either direction. In a trending market it slopes in the direction of the trend. In a ranging market it moves sideways. If price is trading well above the middle band, it’s extended to the upside. If it’s well below, it’s extended to the downside.
UPR
+2σ
+2σ
Upper Band — SMA plus 2 standard deviations
Plotted above the middle band at a distance equal to 2 standard deviations of price over the same 20-period window. Standard deviation is a measure of how much price is varying from its average. When price is very volatile, the standard deviation is high and this band moves far above price. When price is calm and tight, the standard deviation drops and this band contracts toward the middle. Price touching or breaking through the upper band signals strong upward momentum — or potential overextension.
LWR
−2σ
−2σ
Lower Band — SMA minus 2 standard deviations
The mirror image of the upper band, plotted 2 standard deviations below the middle. The same logic applies in reverse: when volatility is high the lower band is far below price, when volatility is low it contracts upward. Price touching or breaking below the lower band signals strong downward momentum — or potential oversold conditions in a ranging market. The distance between the upper and lower bands at any point is called the band width and is a direct visual measure of current volatility.
Why 2 standard deviations? In a normal distribution, approximately 95% of all data points fall within 2 standard deviations of the mean. Applied to price, this means that roughly 95% of all price closes should occur within the Bollinger Bands. When price breaks outside the bands, that’s a statistically unusual event — which is exactly why it’s significant as a signal.
How to Add Bollinger Bands to Your Hyperliquid Chart
Hyperliquid uses a full TradingView chart natively inside the trading interface. Adding Bollinger Bands takes about 30 seconds.
1
Open any perp market on app.hyperliquid.xyz and click “Indicators” at the top of the chart panel.
2
Search for “Bollinger Bands” and select the standard BB indicator. It loads immediately onto the chart.
3
Default settings: Length 20, Std Dev 2.0. These are the universally watched settings — leave them at defaults unless you have a specific reason to change them. The 20-period SMA and 2 standard deviation bands are what most traders are reading on their charts.
4
Best starting timeframes: 4H and Daily charts show the cleanest Bollinger Band signals for swing setups. 1H works well for intraday. The 1-2-3 Money Scanner uses BB(50, 2) on the 5m — a slower version optimised for short timeframe noise reduction.
Reading the Bands — What Every Situation Tells You
Once the bands are on the chart, there are five distinct situations you’ll encounter. Here is what each one means.
📐 Situation 1 — Bands are wide and price is trending
Wide bands = high volatility. In a strong uptrend, price will “walk the upper band” — repeatedly touching or closing near the upper band candle after candle while the middle band slopes upward. This is not an overextension signal during a genuine trend — it’s a momentum confirmation. Similarly in a downtrend, price can walk the lower band for extended periods. Don’t fade a band-walking trend just because price is “near the band.”
📐 Situation 2 — Bands are contracting (the squeeze)
When the upper and lower bands move toward each other, volatility is dropping. The market is consolidating. Energy is coiling. This is the squeeze — and it always precedes a significant move in one direction. The tighter the bands have become relative to their recent history, the more powerful the coming expansion is likely to be. You don’t know the direction yet — you wait for the next signal.
🔥 Situation 3 — Price breaks outside a band (the bubble)
When a candle closes outside the upper or lower band, this is the bubble signal — a statistically unusual price close that signals strong momentum. A close above the upper band = bullish momentum burst. A close below the lower band = bearish momentum burst. In a ranging market, this often means overextension and a reversion to the middle band is likely. In a trending market after a squeeze, it signals the beginning of a new directional move.
📐 Situation 4 — Price returns to the middle band
The middle band (20 SMA) acts as a magnet. After price has extended to the outer bands — either through trending or a bubble close — it typically reverts toward the middle. The middle band is both a target when you’re trading from the outer bands inward, and a support/resistance level in its own right. In an uptrend, price pulling back to the middle band is often a buying opportunity; in a downtrend, a bounce to the middle band is often a shorting opportunity.
📐 Situation 5 — Bands are expanding after a squeeze
When the bands begin to re-expand after a period of contraction, the new directional move has started. The expansion direction (which band is moving faster) and the bubble candle confirm whether the move is bullish or bearish. This is the entry zone for squeeze breakout trades. The bands expanding rapidly means a large move is already underway — late entries at this stage carry more risk than entries on the initial breakout candle.
The True Bollinger Band Squeeze — Bands Inside Keltner Channels
One advanced technique for identifying the highest-quality squeezes combines Bollinger Bands with a second indicator called Keltner Channels. When the Bollinger Bands (blue) contract so tightly that they sit entirely inside the Keltner Channels (red), this is known as the “true squeeze” — a more precise and powerful version of the standard squeeze signal.
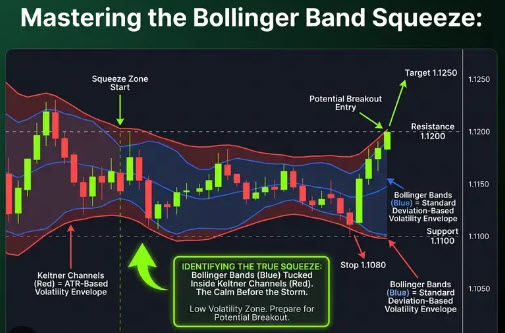
The true squeeze: Bollinger Bands (blue) tucked inside Keltner Channels (red) = the calm before the storm. Breakout entry fires at resistance, target at 1.1250, stop below support at 1.1080.
The chart above illustrates exactly how this looks in practice. The shaded squeeze zone on the left shows the bands tightly contracted and sitting inside the Keltner Channels. Price is grinding sideways with minimal range. When the bands expand and price breaks above resistance at 1.1200 with momentum, the breakout entry is confirmed. The measured target is 1.1250 with a stop below support at 1.1080 — giving the trade a clear R:R before entry.
💡 Bollinger Bands + Keltner Channels — how to add both
On Hyperliquid’s TradingView chart, add Bollinger Bands (BB) first, then search for and add Keltner Channels (KC) as a second indicator. Use default KC settings (20, 1.5 ATR multiplier). When you can see the blue BB lines sitting entirely inside the red KC lines, that’s the true squeeze — maximum compression, highest potential energy. The 1-2-3 Money Scanner automates this detection across 219 markets so you don’t have to find it manually. See the 1-2-3 Money Scanner guide for full details.
Three Ways to Use Bollinger Bands in Your Trading
Bollinger Bands support three distinct trading approaches. Each works best in a different market environment.
Strategy 1 — The Squeeze Breakout
Best in: Any market coming out of a low-volatility period. Works on all timeframes.
Identify a squeeze (bands contracted to a historically narrow width). Wait for a bubble close — a candle closing outside either band with volume confirmation. Enter in the direction of the breakout. Stop goes below the full squeeze range. Target: the measured move (height of squeeze range projected from breakout). This is the highest-probability use of Bollinger Bands and the foundation of both the BB squeeze guide and the 1-2-3 Money Scanner. Full walkthrough: The Bollinger Band Squeeze Guide.
Strategy 2 — Mean Reversion (Band Fade)
Best in: Ranging, sideways markets. Does not work in strong trends.
When price closes at or outside the outer band in a ranging market (not following a squeeze), it’s statistically extended and likely to revert toward the middle band. Buy near the lower band, target the middle. Sell near the upper band, target the middle. The critical filter: confirm the market is ranging, not trending. A price touching the upper band in a strong uptrend is not a sell signal — it’s band-walking momentum. Only fade the bands when the middle band is flat and price has been oscillating between the outer bands without trending in either direction.
Strategy 3 — Trend Continuation (Middle Band Pullback)
Best in: Strong trending markets where price is consistently above or below the middle band.
In a strong uptrend, price repeatedly bounces from the middle band (20 SMA) as support and continues higher. In a downtrend, price repeatedly rejects from the middle band as resistance and continues lower. The entry is on the pullback to the middle band — entering in the direction of the trend when price returns to the SMA. Stop goes below the lower band (for longs) or above the upper band (for shorts). This is a high-conviction trend-following approach that uses the middle band as a dynamic support/resistance level.
📋 Which strategy to use — the quick decision guide
Bands contracting?
→ Squeeze breakout. Wait for bubble candle, trade the direction.
Market ranging sideways?
→ Mean reversion. Buy lower band, sell upper band, target middle.
Strong trend with middle band sloping?
→ Trend continuation. Buy/sell pullbacks to the middle band.
The Most Common Bollinger Band Mistakes
❌
Treating the outer bands as hard buy/sell signals in all conditions
“Price touched the upper band — must be a sell.” Not always. In a trending market, this is a momentum signal, not an overextension signal. Always assess whether the market is ranging or trending before choosing your approach.
❌
Entering a squeeze trade before the breakout candle
The squeeze tells you a move is coming but not which direction. Entering before the bubble close is guessing — you’ll be wrong around 50% of the time with no edge. Always wait for the directional confirmation candle.
❌
Using Bollinger Bands as the only indicator
Bollinger Bands work best as part of a broader analysis. Combine them with volume (confirms real moves), RSI (confirms momentum direction), and a higher-timeframe trend check. No single indicator tells the whole story.
❌
Changing settings constantly to fit past price action
The standard BB(20, 2) settings exist because most traders use them — which gives the signals self-fulfilling weight. Optimising the settings to fit a specific chart’s history is overfitting and will underperform on forward trades. Start with the defaults and only adjust after significant experience with why and when they might not suit a specific market.
Frequently Asked Questions
Go Deeper — The Full Bollinger Band Series
📊 Part 2
The Bollinger Band Squeeze Guide
💰 Part 3The 1-2-3 Money Scanner
📊 ChartsHow to Read a Hyperliquid Chart
🛡 RiskHow to Set a Stop-Loss on Hyperliquid
📐 SizingHow to Size a Trade (Position Sizing)
₿ BitcoinHow to Trade Bitcoin on Hyperliquid
The Bottom Line
Bollinger Bands do one thing exceptionally well: they tell you whether a market is quiet or active, and whether price is extended or mean-reverting relative to its recent history. That single piece of information — current volatility in context — unlocks three distinct and profitable trading strategies depending on which phase the market is in.
Add them to your Hyperliquid chart today. Spend a few sessions just watching how the bands respond to price action without trading — identify squeezes, watch bubbles fire, watch price revert to the middle band. The visual pattern recognition that comes from observation is worth more than any strategy guide. Once you can read the bands instinctively, the strategy almost writes itself.
Not Yet on Hyperliquid? Start Here
Wallet setup, first deposit, first trade — the complete beginner’s walkthrough.
| READ THE ULTIMATE GUIDE → |

📘 CryptoJag Digital Product
The Hyperliquid Blueprint
How to Connect, Trade, and Profit on the World’s Fastest DEX — including technical analysis, chart reading, and Bollinger Band strategy.
| GET THE BLUEPRINT → |
🎬 Video Courses
Watch. Follow along. Get it done.
Short, focused video courses — on screen, step by step.
🎁 Try It on Hyperliquid — Get 4% Off
Sign Up via My Referral Link
Permanent 4% taker fee discount applied automatically. Use limit orders on BB entries and the fee is zero — you collect a rebate.
🇺🇸 US Residents: Use a VPN first — I use FastVPN by Namecheap.
Use code CRYPTOJAG or click the link above
🎬 Watch Bollinger Band setups live on YouTube
Subscribe to CryptoJag for live chart walkthroughs showing Bollinger Bands in real trading situations on Hyperliquid.
| ▶ SUBSCRIBE ON YOUTUBE |

— Chris
Founder · CryptoJag
Bollinger Bands were one of the first indicators I actually understood — not just how to add them to a chart, but why they work. The insight that stuck with me was simple: volatility contracts before it expands, always. Once you see that pattern repeatedly — the tight squeeze followed by the explosive move — you start to develop patience. You stop needing to trade every candle and start waiting for the moments where the market is genuinely coiling. Most of the trades that have worked best for me started with a Bollinger Band squeeze. The indicator is basic. The discipline to use it correctly is not.
This post is for educational purposes only and does not constitute financial or trading advice. Bollinger Bands are a technical analysis tool and do not guarantee profitable trades. All trading involves risk. The Hyperliquid referral link earns CryptoJag a commission at no additional cost to you.