
The Fibonacci Code: Cracking Cryptocurrency Patterns with Precision
Introduction
Trading cryptocurrencies can feel like navigating a stormy sea. Prices surge and crash in unpredictable ways, leaving even experienced traders puzzled. However, some tools and techniques help bring order to the chaos, and one of the most powerful among them is the Fibonacci sequence. Derived from a centuries-old mathematical pattern, Fibonacci tools have become essential in the toolkit of cryptocurrency traders for predicting price movements with precision.
In this blog post, we’ll explore what the Fibonacci sequence is, how it applies to trading, and how you can use Fibonacci retracements, extensions, and arcs to decode cryptocurrency market patterns and trade more effectively.
1. What Is the Fibonacci Sequence?
The Fibonacci sequence is a series of numbers where each number is the sum of the two preceding ones:
0,1,1,2,3,5,8,13,21,…
As the sequence progresses, the ratio between successive numbers approaches 1.618, known as the golden ratio or phi (Φ). This ratio and its inverse, 0.618, are found throughout nature, from flower petals to galaxies, and even in human behavior.
In trading, Fibonacci ratios (0.236, 0.382, 0.5, 0.618, 0.786, and extensions such as 1.618, 2.618) are used to identify potential levels of support and resistance, key turning points where prices are likely to reverse or consolidate.
2. How Fibonacci Tools Work in Cryptocurrency Trading
Fibonacci tools work by analyzing historical price action to predict future market behavior. Let’s dive into the primary Fibonacci tools used in cryptocurrency trading:
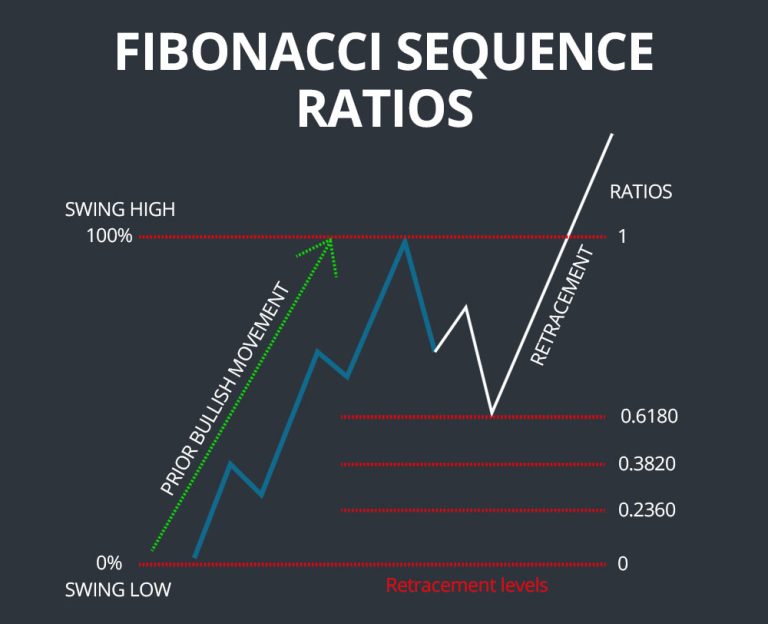
1. Fibonacci Retracement
A Fibonacci retracement is used to identify levels at which a price correction is likely to reverse. Traders apply this tool after a significant price movement (upward or downward) by drawing the retracement levels between the swing high and swing low.
Key Levels:
- 23.6%: Minor retracement level; prices may pause briefly.
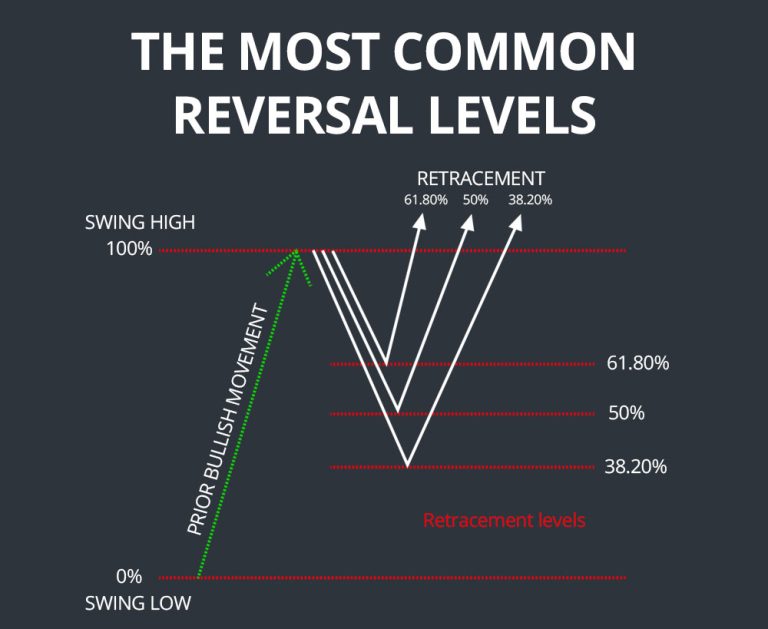
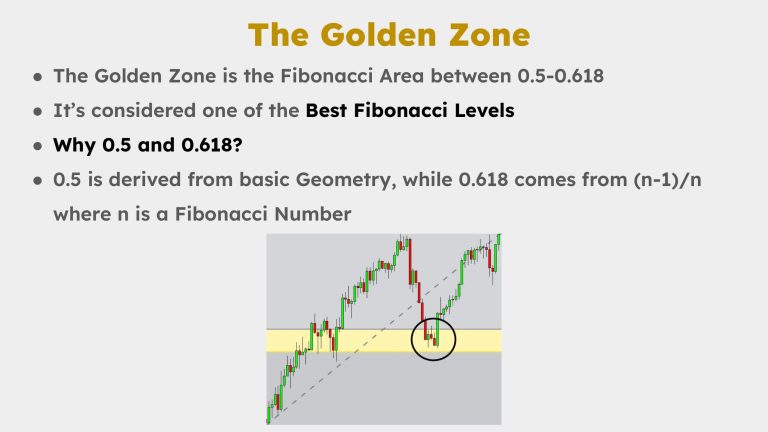
- 38.2% and 50%: Common levels for corrections in crypto, acting as strong support or resistance.
- 61.8%: The golden ratio; a crucial level where reversals are likely to occur.
How to Use:
For instance, if Bitcoin surges from $30,000 to $40,000 and then starts pulling back, drawing Fibonacci retracement levels helps predict where the price might find support—say, at $36,180 (61.8%) or $35,000 (50%).
2. Fibonacci Extensions
Fibonacci extensions project potential future price targets during trending markets. These levels are drawn beyond the swing high or low and are particularly useful for identifying take-profit levels.
Key Levels:
- 1.618: A common target for extended bullish or bearish moves.
- 2.618 and 3.618: Used for parabolic price movements.
How to Use:
Suppose Ethereum rises from $1,000 to $1,500, retraces to $1,300, and then resumes its upward trend. Applying Fibonacci extensions can give you potential targets, such as $1,800 (1.618) or $2,100 (2.618).
3. Fibonacci Arcs and Fans
Fibonacci arcs and fans use circular arcs or diagonal lines, respectively, to predict dynamic support and resistance levels. These tools are less common but can provide additional insights into price behavior.
How to Use:
These tools are best suited for visualizing trends and can complement retracement and extension levels. For example, arcs can highlight areas of consolidation, while fans can indicate trendlines that the price might follow.
3. Why Fibonacci Tools Work in Cryptocurrency
Cryptocurrency markets are largely driven by speculation and human psychology, which Fibonacci tools align with closely. Traders and investors often act based on patterns and emotional responses, such as fear and greed. These psychological triggers create repeating patterns in price charts that Fibonacci tools can help decode.
- Market Sentiment: Fibonacci levels often align with key psychological thresholds where traders set buy or sell orders.
- Trend Reversals: Fibonacci levels mark areas where buyers or sellers might regain control, causing reversals.
- Self-Fulfilling Prophecy: Many traders use Fibonacci levels, making them more effective as they become self-reinforcing.
4. Real-World Example: Using Fibonacci in Crypto Trading
Let’s illustrate how Fibonacci retracements and extensions work with a practical example:
Case Study: Bitcoin Bull Run
Imagine Bitcoin’s price surged from $20,000 to $60,000. After hitting $60,000, the price starts to correct.
Applying Fibonacci Retracement:
- Draw the retracement levels from $20,000 (swing low) to $60,000 (swing high).
- Key levels are:
- 38.2%: $47,280
- 50%: $40,000
- 61.8%: $35,120
Price Behavior:
- The price pulls back to $40,000 (50% retracement level) and consolidates, showing signs of support.
- Traders identify this level as a buying opportunity.
Applying Fibonacci Extensions:
- After rebounding from $40,000, Bitcoin resumes its uptrend.
- Using Fibonacci extensions, potential targets are calculated beyond $60,000:
- 1.618: $80,480
- 2.618: $100,960
Outcome:
- Bitcoin rallies to $80,000, hitting the 1.618 extension, where profit-taking begins.
5. Common Mistakes When Using Fibonacci Tools
While Fibonacci tools are powerful, they’re not foolproof. Here are some common mistakes to avoid:
- Forgetting Market Context: Fibonacci tools work best when combined with other indicators, such as volume, RSI, or moving averages.
- Ignoring the Trend: Applying Fibonacci levels in a choppy, sideways market often leads to false signals.
- Overreliance on a Single Level: Use multiple levels and watch for confluence with other technical indicators.
- Misidentifying Swing Highs and Lows: Accurately pinpointing these points is critical for effective Fibonacci analysis.
6. Combining Fibonacci with Other Strategies
To maximize the accuracy of Fibonacci tools, combine them with other trading strategies:
- Support and Resistance: Look for overlaps between Fibonacci levels and historical support/resistance zones.
- Candlestick Patterns: Use Fibonacci levels alongside reversal patterns like hammer, doji, or engulfing candles.
- Trendlines: Confirm Fibonacci levels with trendlines to identify strong areas of support or resistance.
- RSI Divergence: If RSI shows divergence at a key Fibonacci level, it may indicate a strong reversal.
7. Advanced Tips for Using Fibonacci Tools
- Confluence is Key: The more Fibonacci levels align with other technical indicators or historical price levels, the stronger the signal.
- Combine Multiple Time Frames: Use Fibonacci levels on different time frames (e.g., daily, 4-hour) to get a clearer picture.
- Use Dynamic Levels: Pair Fibonacci with dynamic levels like moving averages for greater accuracy.
- Stay Disciplined: Don’t blindly trust Fibonacci levels. Always set stop-loss orders and manage risk effectively.
Conclusion
The Fibonacci sequence has transcended its mathematical origins to become one of the most reliable tools in cryptocurrency trading. By applying Fibonacci retracements, extensions, and other tools, traders can decode market patterns, identify potential turning points, and make more informed decisions.
However, like any trading tool, Fibonacci levels are not a guarantee of success. They work best when combined with a disciplined approach, sound risk management, and other technical and fundamental analysis methods.
If you’re looking to enhance your trading strategy, mastering the Fibonacci code could be your gateway to cracking cryptocurrency patterns with precision. Remember, the market follows patterns, and those who can read them stand the best chance of success.