What Does the RSI Indicator Actually Mean? A Practical Guide for Crypto Traders

Relative Strength Index clearly defined and how we use it to trade crypto!

The RSI (Relative Strength Index) is one of the most widely used indicators in crypto trading — and also one of the most misunderstood.

Many traders treat RSI like a simple buy/sell signal:

  • RSI below 30? Buy.

  • RSI above 70? Sell.

That oversimplification is exactly why so many traders misuse it.

In reality, RSI is not a prediction tool.
It’s a momentum and strength indicator that helps traders understand how price is behaving, not where it’s guaranteed to go next.

In this guide, we’ll break down:

  • What RSI actually measures

  • How RSI works in crypto markets

  • Why RSI behaves differently in trends vs ranges

  • Common RSI mistakes

  • How traders use RSI correctly in 2026

No hype. No magic signals. Just clarity.

What Is the RSI Indicator?

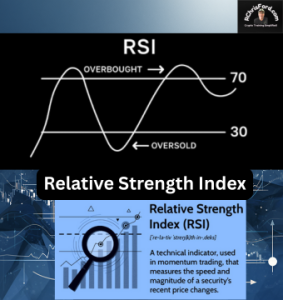
RSI stands for Relative Strength Index.

It’s a momentum oscillator that measures the speed and strength of recent price movements.

RSI moves on a scale from 0 to 100 and compares:

  • The magnitude of recent gains

  • Versus the magnitude of recent losses

This tells traders whether price is gaining strength, losing strength, or staying balanced.

Default RSI Levels

  • Above 70 → Strong momentum / potentially overextended

  • Below 30 → Weak momentum / potentially oversold

Important note:
“Overbought” does not mean price must fall.
“Oversold” does not mean price must rise.

Those terms describe momentum conditions, not predictions.

What RSI Is REALLY Telling You

RSI answers one core question:

Is buying pressure stronger than selling pressure — or vice versa?

That’s it.

RSI does not tell you:

  • Where the top or bottom is

  • When price will reverse

  • What will happen next

Instead, it helps you understand market behavior.

In crypto — where volatility is high and emotions move fast — that insight is extremely valuable.

Why RSI Works Well in Crypto Markets

Crypto markets are:

  • Highly emotional

  • Momentum-driven

  • Prone to sharp expansions and contractions

RSI excels in these conditions because it:

  • Reacts to changes in momentum

  • Helps traders avoid chasing moves late

  • Provides context during volatile periods

However, RSI must be used correctly — and always with awareness of market structure.

RSI in Trending Markets vs Ranging Markets

This is where most traders go wrong.

RSI in Ranging (Sideways) Markets

In range-bound markets:

  • RSI tends to oscillate cleanly between 30 and 70

  • Mean-reversion strategies work better

  • RSI extremes can signal potential reversals

In these conditions, RSI can help traders:

  • Buy near lower momentum zones

  • Sell or reduce exposure near higher momentum zones

RSI in Trending Markets

In strong trends:

  • RSI may stay above 50 (uptrend)

  • Or below 50 (downtrend)

  • RSI can remain overbought or oversold for long periods

This is why selling just because RSI is above 70 in a strong uptrend often leads to missed gains.

In trends, RSI is better used to:

  • Confirm trend strength

  • Identify pullbacks

  • Avoid counter-trend trades

The 50 Level: The Most Overlooked RSI Zone

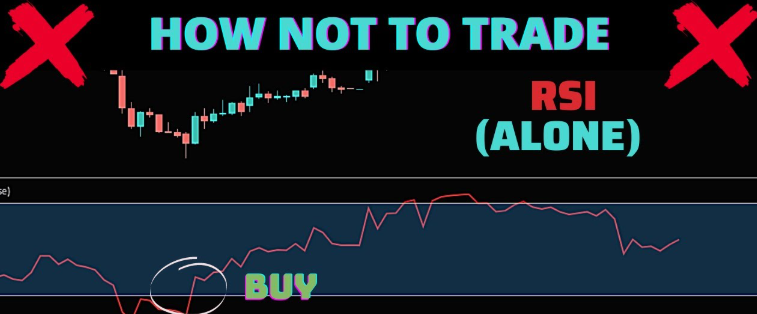
Most traders focus only on 30 and 70.

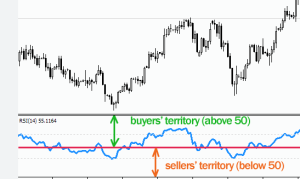
Professionals pay close attention to RSI 50.

Why?

Because:

  • RSI above 50 suggests bullish momentum

  • RSI below 50 suggests bearish momentum

In many crypto trends:

  • Price remains strong as long as RSI holds above 50

  • Trend weakness appears when RSI consistently loses 50

This makes RSI a trend confirmation tool, not just a reversal indicator.

RSI Divergence (What It Is — and What It Isn’t)

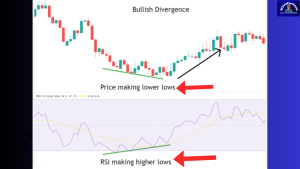
RSI divergence occurs when:

  • Price makes a higher high, but RSI makes a lower high

  • Or price makes a lower low, but RSI makes a higher low

This suggests momentum is weakening, even if price is still moving.

Important clarification:

  • Divergence does not mean price will reverse immediately

  • It signals potential exhaustion

In crypto, divergence is best used to:

  • Reduce risk

  • Tighten stops

  • Avoid adding late to a move

Not as a standalone entry signal.

Common RSI Mistakes in Crypto Trading

Here’s why RSI “doesn’t work” for many traders — it’s misused.

Mistake #1: Treating RSI as a Buy/Sell Button

RSI is context, not a command.

Mistake #2: Ignoring Market Structure

RSI behaves differently in trends vs ranges.

Mistake #3: Using RSI Alone

RSI works best when combined with:

  • Support and resistance

  • Trend direction

  • Risk management

Mistake #4: Overtrading RSI Signals

Crypto rewards patience more than activity.

A Simple RSI Framework for Crypto Traders

Here’s how many traders use RSI cleanly in 2026:

  1. Start with trend direction

    • Is the market trending or ranging?

  2. Use RSI to confirm, not predict

    • Momentum should align with your bias

  3. Respect RSI 50

    • Above = bullish momentum

    • Below = bearish momentum

  4. Avoid extremes in strong trends

    • Overbought ≠ sell in an uptrend

    • Oversold ≠ buy in a downtrend

  5. Plan risk first

    • RSI doesn’t replace stop losses

This approach reduces emotional trades and improves consistency.

Why RSI Still Matters in 2026

As crypto matures, markets reward:

  • Discipline

  • Risk management

  • Understanding momentum

RSI remains relevant because it:

  • Adapts to volatility

  • Works across timeframes

  • Encourages patience

It’s not flashy — and that’s exactly why it works.

RSI vs Other Indicators

Compared to many indicators, RSI:

  • Is simple

  • Is widely understood

  • Reflects real market behavior

That makes it ideal for traders who want:

  • Fewer tools

  • Clearer signals

  • Less screen time

In 2026, simplicity is an advantage.

Education Matters More Than Indicators

No indicator will make you profitable on its own.

Most traders fail because they:

  • Skip risk management

  • Overtrade

  • Ignore structure

  • Trade emotionally

That’s why many traders start with structured education before risking capital.

If you’re looking for a clear, beginner-friendly introduction to crypto trading, there’s a free 1-Day Trading Course that walks through:

  • Market structure

  • Risk management

  • Simple indicator-based strategies

  • Common mistakes to avoid

👉 Access the free 1-Day Crypto Trading Course here:
https://earncryptoprofits.com

No hype — just fundamentals you can actually use.

Final Thoughts

RSI doesn’t predict the future.

It helps you understand momentum, strength, and market behavior.

Used correctly, RSI:

  • Keeps traders out of emotional decisions

  • Helps align with trend strength

  • Encourages patience over guessing

In crypto trading, that edge matters.

The goal isn’t to trade more —
it’s to trade better.

Facebook
Twitter
LinkedIn
Pinterest
Crypto Training Simplified